
Everyone in the forex and stock world has heard the classic rule: buy low, sell high. Simple enough to say. Incredibly hard to execute without the right tools. That's exactly where stock trading signals come in — and if you've ever wished you had a reliable compass in the chaos of the financial markets, this guide is going to change the way you trade.
Whether you're a seasoned forex trader managing a multi-asset portfolio or a newer investor still learning the ropes, understanding how trading signals work gives you a genuine edge. In this guide, we'll break down everything — what signals are, how they're generated, which technical indicators matter most, and how you can start using them to make smarter, more confident decisions. Let's dive in.
What Are Stock Trading Signals?

At their core, stock trading signals are data-driven indicators that tell you when a potentially profitable buying or selling opportunity might be forming. They're not guesses or gut feelings — they're derived from complex algorithms, rigorous technical analysis, and real-time market data designed to surface meaningful patterns before most traders even notice them.
Think of a trading signal as a heads-up from the market itself. The data crunches price movements, volume shifts, volatility spikes, and broader market conditions — then packages all of that into an actionable insight you can actually trade on. For forex traders especially, where markets move fast and margins can be tight, having that early warning system is invaluable.
Signals don't remove risk entirely — nothing does — but they dramatically improve your probability of making decisions grounded in evidence rather than emotion.
The 3 Most Powerful Trading Signals Every Forex Trader Should Know
Not all signals are created equal. Some are simple and intuitive; others require a deeper understanding of market mechanics. Here are the three core signal types that professional traders rely on day in and day out.
Moving Average Crossover
When a short-term moving average crosses above the long-term line, it's a classic buy signal. When it dips below, prepare to sell. Clean, simple, and battle-tested.
RSI — Relative Strength Index
Measures momentum and speed of price movement. Above 70 = overbought (potential sell). Below 30 = oversold (potential buy). A favourite for timing market entries.
MACD Divergence
Tracks the relationship between two moving averages. A bullish crossover above the signal line = green light to buy. Below = bearish warning to reconsider your position.
Moving Average Crossover: The Golden Cross and Death Cross

The Moving Average Crossover is probably the most widely recognised signal in all of technical analysis — and for good reason. It's straightforward, visual, and remarkably effective when applied correctly.
When a 50-day moving average crosses above a 200-day moving average, traders call it a Golden Cross — a bullish signal suggesting a sustained upward trend may be forming. The opposite scenario — a short-term average dropping below the long-term one — is called a Death Cross, and it typically warns of a downtrend ahead.
For forex traders, combining moving averages with volume data makes these signals even more reliable. A Golden Cross backed by rising volume is far more significant than one occurring on low trading activity.
💡 Pro Tip
Never trade a Moving Average Crossover signal in isolation. Combine it with the RSI to confirm momentum or with support/resistance levels to validate the price zone. Confluence is the key to high-probability setups in forex markets.
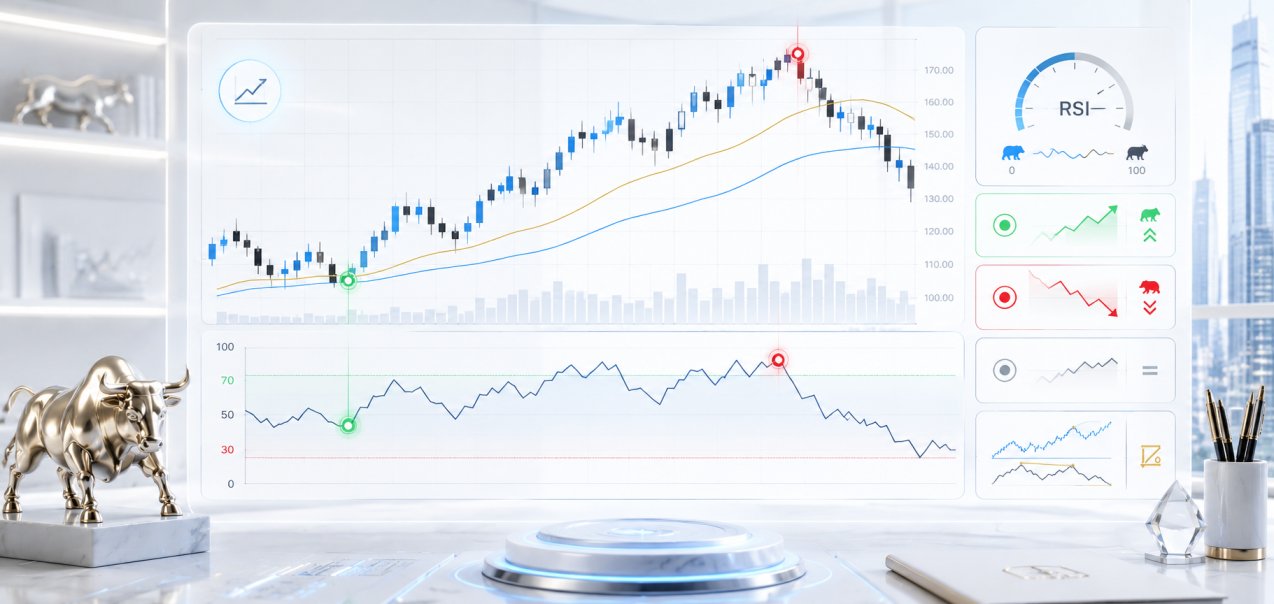
RSI: Your Market Thermometer
The Relative Strength Index (RSI) does something incredibly useful — it tells you not just where the price is, but how fast it got there and whether that momentum is sustainable. Developed by J. Welles Wilder, the RSI oscillates between 0 and 100.
- RSI above 70: The asset is overbought. Price may have run too far, too fast. This is often a signal that a correction or reversal could be coming — consider taking profits or tightening your stop-loss.
- RSI below 30: The asset is oversold. Sellers may have pushed prices too low, creating a potential bounce or reversal opportunity — a compelling entry point for well-timed buyers.
- RSI around 50: Neutral territory. The market is balanced and may be consolidating before its next significant move.
- RSI divergence: When price makes a new high but RSI doesn't confirm it (or vice versa), this divergence is one of the most powerful early warning signs of a trend reversal in forex trading.
MACD Divergence: Where Momentum Tells the Real Story
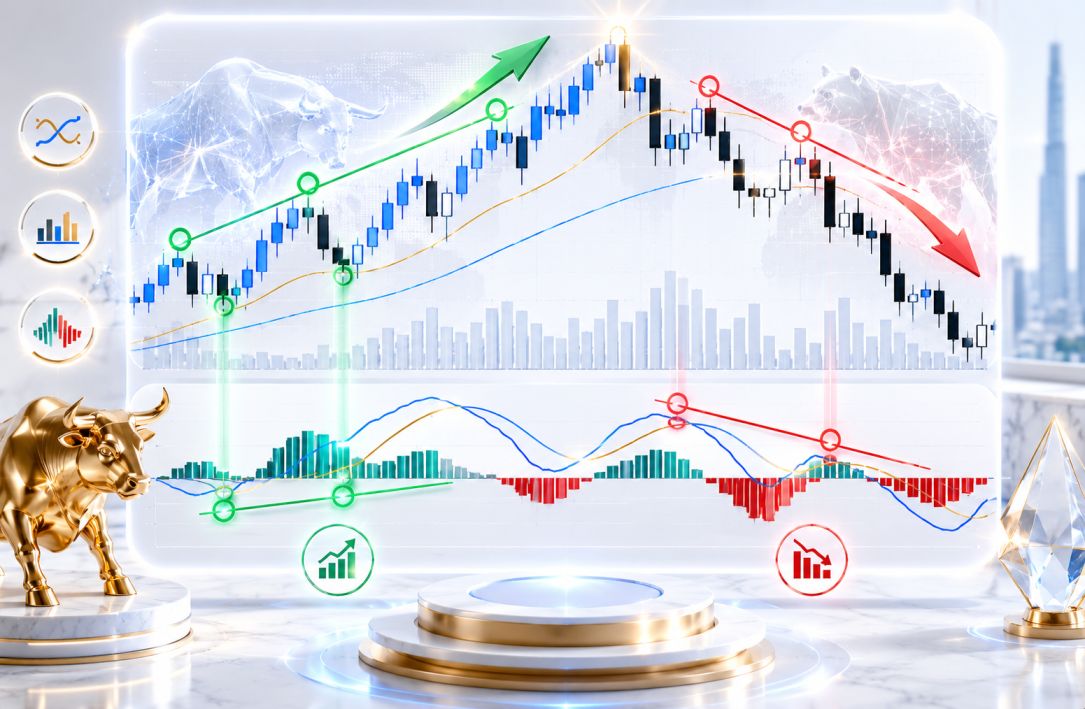
The Moving Average Convergence Divergence (MACD) is a momentum oscillator that captures the relationship between two exponential moving averages — typically the 12-period and 26-period EMA. When the MACD line crosses above its signal line, you have a bullish setup. When it crosses below, bearish pressure is building.
What makes MACD particularly valuable for forex traders is its ability to reveal divergence — situations where price action and the MACD indicator move in opposite directions. This is often a leading indicator of a trend shift before it shows up clearly on the price chart itself.
Bearish divergence (price makes a higher high, MACD makes a lower high) is a warning sign in uptrending markets. Bullish divergence (price makes a lower low, MACD makes a higher low) is a potential entry signal in downtrending ones. Master divergence reading and you'll see the market differently.
How Stock Trading Signals Actually Work
Behind every signal is a process. Trading signals don't materialise from thin air — they emerge from a structured analytical framework that processes enormous volumes of market data in real time. Here's how that process typically unfolds:
- Data collection: Price data, volume metrics, historical patterns, volatility measures, and broader market conditions are gathered continuously across multiple timeframes and instruments.
- Pattern recognition: Statistical models and technical analysis frameworks scan the data for recurring patterns — candlestick formations, support/resistance breaks, indicator crossovers, and momentum shifts.
- Signal generation: When specific conditions align — such as an RSI reading below 30 combined with a bullish MACD crossover — a signal is generated and flagged for the trader.
- Interpretation & execution: The trader reviews the signal in context, considers risk parameters, and decides whether to enter, wait for confirmation, or pass altogether.
🔧 Technical Tools Behind the Signals
The most effective signal systems combine multiple technical tools simultaneously: Candlestick Charts for visual pattern identification, Simple and Exponential Moving Averages for trend direction, Oscillators like RSI and Stochastic for momentum, and Volume indicators to confirm the strength behind any move. When these tools agree, the probability of a successful trade increases significantly.
4 Reasons Why Smart Forex Traders Rely on Trading Signals
There's a reason professional traders and institutional investors have been using signal-based strategies for decades. The benefits are real, tangible, and particularly pronounced in the fast-moving world of forex trading.

1. They Save You Enormous Time
Manually scanning dozens of currency pairs and stocks for opportunities is exhausting. Trading signals automate that scanning process, delivering pre-analysed opportunities directly to you. Instead of spending hours in front of charts, you spend your time evaluating the best opportunities and managing your positions strategically.
2. They Remove Emotional Bias
Fear and greed are the two biggest destroyers of trading accounts. When you're up big, greed tells you to push harder; when you're down, fear tells you to exit at the worst possible moment. Signals provide objective, data-driven guidance that cuts through the emotional noise and keeps your decision-making process rational and disciplined.
3. They Enhance Returns While Managing Risk
The best trading signals don't just tell you when to enter — they also tell you when to exit. Built-in stop-loss levels, take-profit targets, and exit signals help you protect your capital while maximising your gains. That combination — better entries, disciplined exits — is what separates consistently profitable traders from the rest.
4. They Accelerate Your Learning Curve
For newer forex traders, following quality signals is one of the fastest ways to develop a deep understanding of market dynamics. You're not just copying trades — you're observing how experienced traders read technical conditions, time entries, and manage risk. Over time, that exposure builds intuition and confidence you simply can't get from textbooks alone.
Actionable Tips for Using Trading Signals Effectively
- Always use multiple confirmations. One indicator firing is interesting; three indicators agreeing is a high-conviction setup. Never trade on a single signal in isolation.
- Respect your risk management rules. Even the best signals fail sometimes. Set your stop-losses before entering any trade and never risk more than 1–2% of your account on a single position.
- Match signals to your timeframe. A signal that works brilliantly on a daily chart might be completely irrelevant on a 5-minute chart. Make sure the signal source aligns with your trading style.
- Keep a trading journal. Record every signal you follow, whether you entered the trade, and the outcome. Over time, patterns emerge that help you refine your approach.
- Stay patient — not every signal requires action. Professional traders are selective. It's better to miss a good trade than to force a bad one based on a questionable signal.
- Use signals as a complement to your strategy. Signals are a powerful tool, but they work best when layered on top of a well-defined trading strategy with clear risk parameters.
Frequently Asked Questions
Conclusion: Signals Are Your Edge — Use Them Wisely
Stock trading signals aren't magic — but in the hands of a disciplined, informed trader, they come pretty close. They automate the hard work of market analysis, cut through emotional noise, and surface high-probability opportunities that would otherwise be impossible to identify manually at scale.
Whether you're trading major forex pairs, exploring equities, or diversifying across multiple markets, building a strategy around quality signals is one of the most practical and proven approaches available. The three pillars — Moving Average Crossovers, RSI momentum readings, and MACD divergence — give you a comprehensive toolkit that covers trend direction, momentum strength, and early reversal detection all at once.
The markets will always be uncertain. That's what creates opportunity. With the right signals, the right strategy, and the right discipline, you can navigate that uncertainty with confidence — and turn it to your advantage.
Ready to Trade Smarter with Real-Time Signals?
Join thousands of forex traders who trust fxTsignals.com for accurate, data-driven signals that make a real difference. Start making confident, informed trading decisions today.
Get Your Free Signals Now →