How to Master Support and Resistance Levels and Finally Trade with Confidence
Every profitable forex trader understands one fundamental truth — price does not move randomly. Support and resistance are the invisible forces shaping every chart. Learn to read them, and the market starts speaking to you.
Why Support and Resistance Are the Foundation of Every Trading Decision
If you have been trading forex for any length of time, you have probably heard the terms "support" and "resistance" thrown around constantly. But knowing the words and truly understanding how to apply them are two very different things. The gap between those two is often what separates consistently profitable traders from those who break even — or worse.
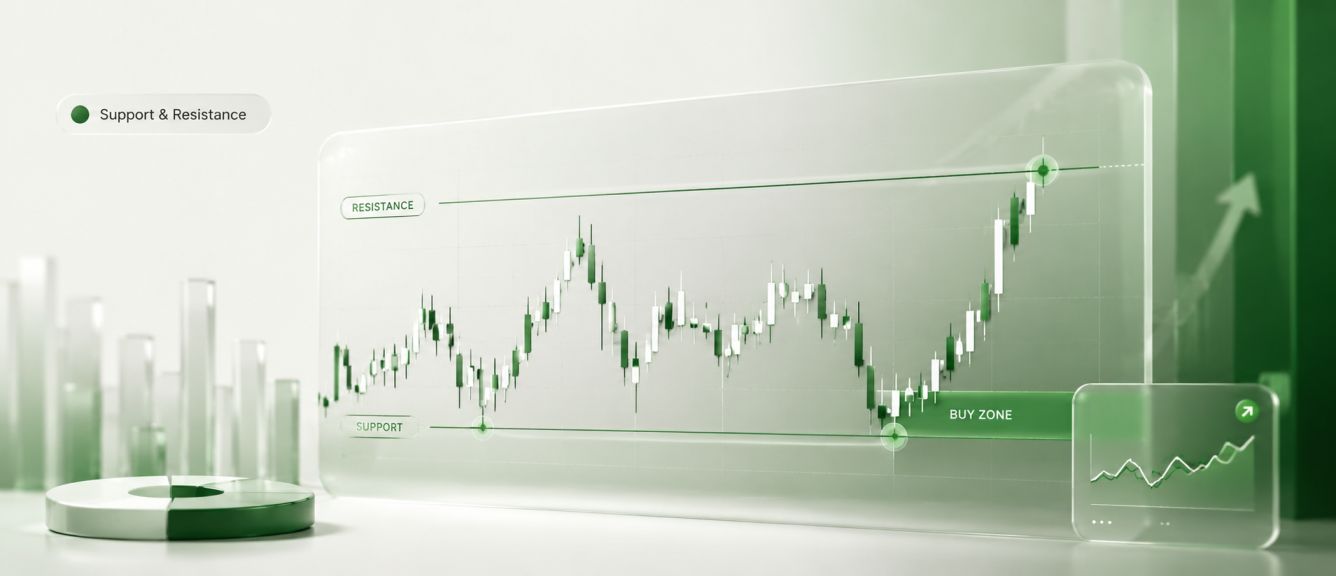
Support and resistance levels are price zones where the battle between buyers and sellers becomes the most intense. They are not just lines on a chart. They represent the psychology of the market — the collective memory of every trader who has participated at those price points. Understanding this deeply changes how you see every candlestick, every bounce, every breakout.

What Exactly Is a Support Level?
Think of support as the floor beneath the price. When an asset is falling, support is the zone where buying pressure becomes strong enough to halt or reverse that decline. Demand overtakes supply, and the bears begin losing control.
What makes a support level meaningful? It forms when price has previously bounced from the same area multiple times. The more often it holds, the stronger the floor becomes — and the more traders are watching and reacting to it.
- Previous swing lows — historical price points where the market reversed upward
- Rising trendlines — dynamic support that follows the uptrend
- Moving averages — the 50 EMA or 200 SMA often act as floating support
- Round number levels — psychological price points like 1.2000 or 1.3500
- Chart patterns — the neckline of a pattern, for example, creates powerful support
And What About Resistance?
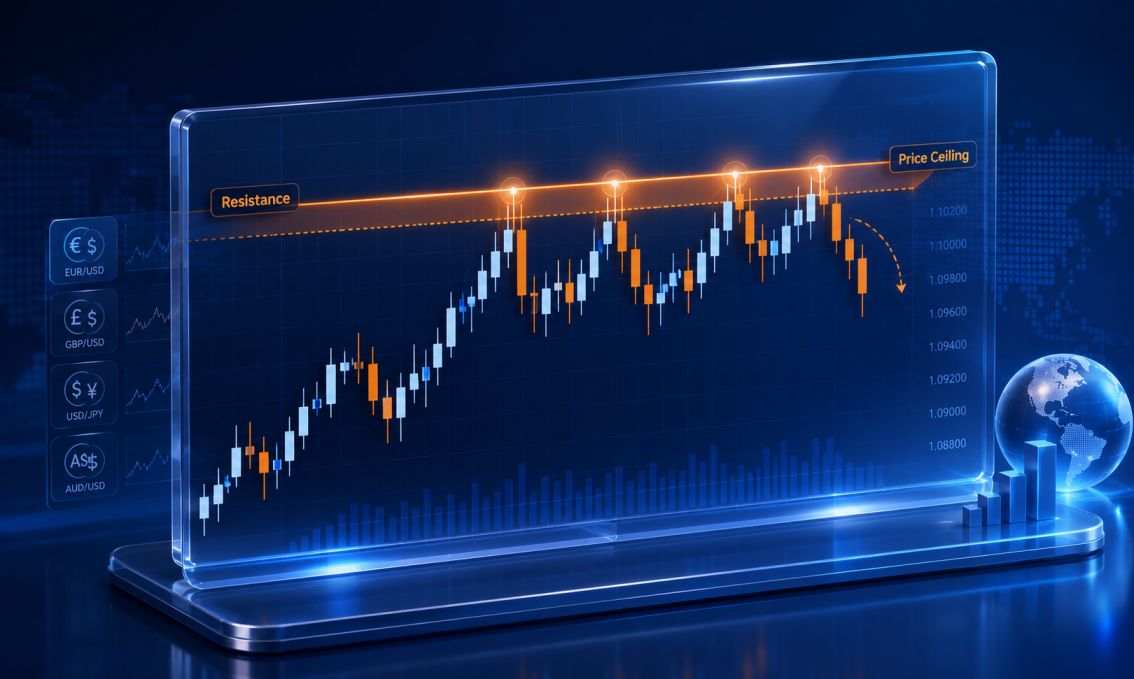
Resistance is the ceiling. When price climbs toward a resistance zone, supply begins to outpace demand. Sellers take control, and price stalls or falls back. Every trader who bought below and wants to exit profitably, every trader who shorted and is defending their position — they all converge at resistance.
The more times resistance is tested without being broken, the more powerful it becomes. But here is the critical insight most beginners miss: strong resistance that finally breaks often transforms into equally strong support. This concept is called role reversal, and it is one of the most reliable phenomena in all of technical analysis.
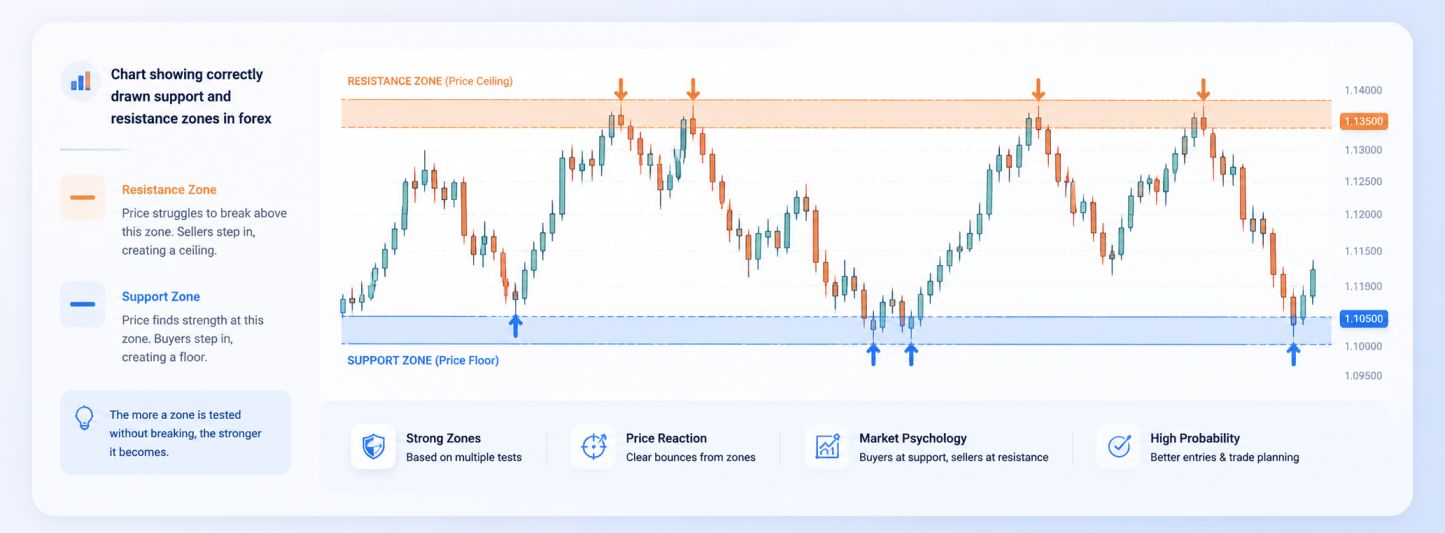
How to Draw Support and Resistance Lines the Right Way
One of the most common mistakes new traders make is drawing too many lines and cluttering their charts until everything looks like support or resistance. Real precision here matters. Here is a clean, practical approach to identifying and drawing valid levels.
- Zoom out first. Start on the weekly or daily chart. The highest-timeframe levels carry the most weight. Once identified, drop to your entry timeframe to refine them.
- Look for clusters, not exact points. Price rarely reverses at a precise number twice. Treat support and resistance as zones — typically 5–20 pips wide depending on the pair and timeframe.
- Connect the closes. Use candle close prices rather than wicks when possible. Closes reflect conviction; wicks reflect noise and emotional spikes.
- Validate with volume. A level with multiple touches accompanied by high volume is far more significant than one with thin participation. Volume is the fuel behind price reactions.
- Keep it clean. Three to five major levels on any chart is usually enough. If you have ten lines on your chart, none of them are actually significant.
Four Key Characteristics Every Trader Must Understand
Support and resistance are not static concepts. They behave according to predictable patterns that, once recognized, become powerful edges in your trading. Here are the four most important characteristics to internalize.
Role Reversal
When a support level breaks convincingly, it does not disappear. It flips and becomes resistance. Price often returns to test the broken level from the other side — a concept called "retest." This gives disciplined traders a second opportunity to enter in the direction of the breakout.
Strength in Numbers
A support level touched twice is noteworthy. One touched four or five times over several months is a high-probability zone. Multiple time confirmations mean more traders are watching and reacting there, which creates a self-reinforcing cycle of price behavior.
Breakouts vs. Fakeouts
Not every break of a level is genuine. Fakeouts — where price briefly pierces a level before snapping back — are extremely common, especially around major news events. Always wait for a confirmed close beyond the level, and ideally a retest, before committing to a breakout trade.
Timeframe Context
A support level on the 1-hour chart is far less significant than one on the daily or weekly chart. Higher timeframe levels attract more participants and carry more weight. When multiple timeframes align at the same level, you have an extremely powerful zone.
"Support and resistance are the foundation of technical analysis — they act as your guiding light in the turbulent sea of financial markets."
— fxTsignals.comTwo Proven Strategies That Actually Work in Live Markets
Understanding the theory of support and resistance is one thing. But making money from it requires a structured approach to entering, managing, and exiting trades. Here are the two most reliable strategies built around these levels.
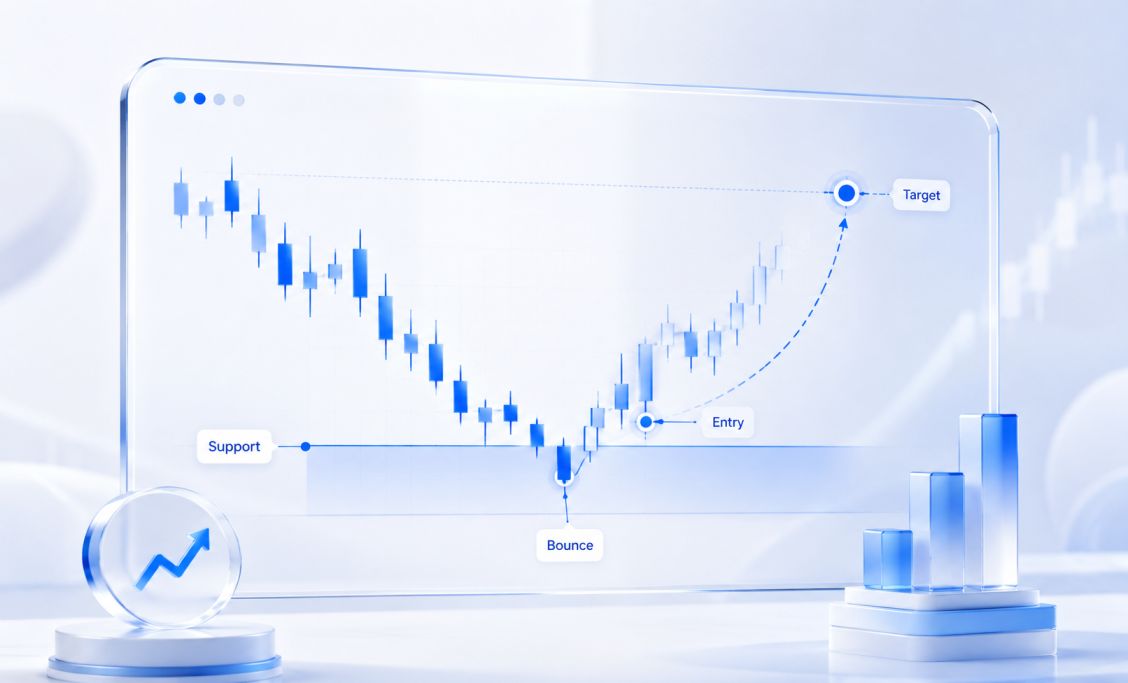
Strategy 1: The Bounce Trade
The bounce trade is exactly what it sounds like — you wait for price to approach a high-probability support or resistance level and enter in anticipation of it bouncing away. This is a mean-reversion approach that works especially well in ranging markets.
How to Execute the Bounce Trade
- Identify a strong level with at least 2–3 prior reactions
- Wait for price to approach and show a reaction — a rejection wick, engulfing candle, or pin bar
- Enter on the close of the confirming candle with a stop just beyond the level
- Target the next major support/resistance level for your take-profit
- Risk no more than 1–2% of account equity per trade
For example, if EUR/USD has bounced three times from the 1.0850 level over the past month, and price is approaching it again with a bearish engulfing candle forming, that is a textbook bounce trade setup. Your stop goes at 1.0830, and your target sits at the next resistance near 1.0950.
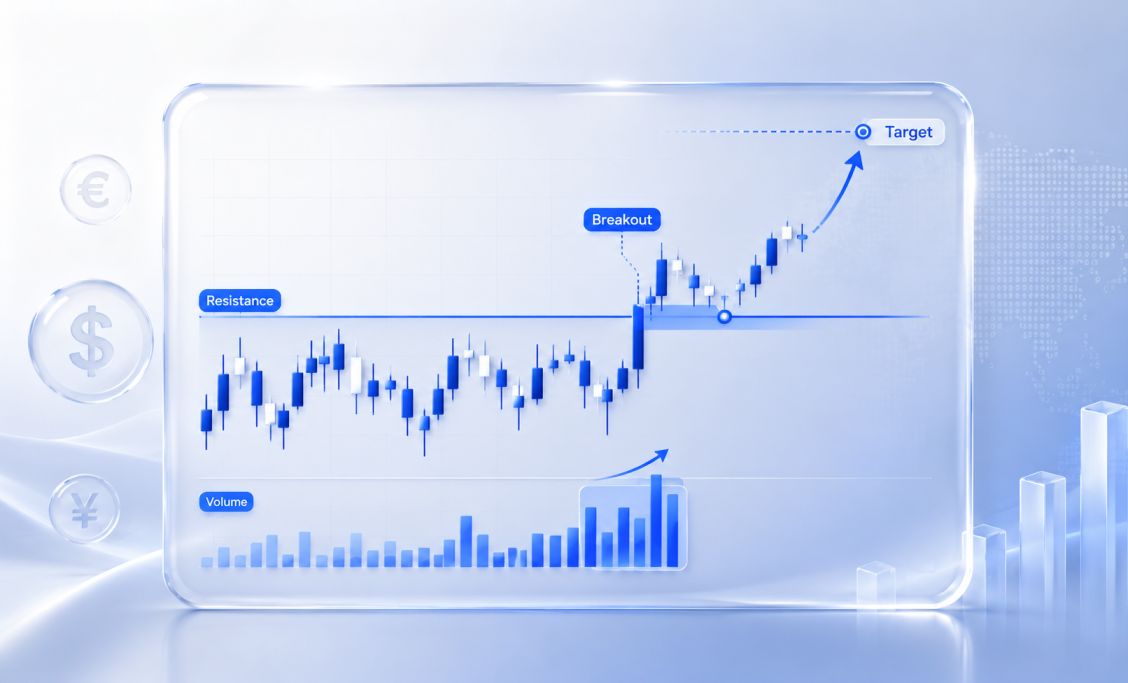
Strategy 2: The Breakout Trade
When price has been consolidating near a major resistance level and finally breaks above it with conviction, the resulting move can be explosive. Breakout traders capitalize on these moments — but patience and confirmation are everything.
How to Execute the Breakout Trade
- Identify a level that has been tested multiple times without breaking
- Watch for a candle close above resistance (or below support) on elevated volume
- Look for a retest of the broken level before entering — this is the safest entry
- Place stop-loss below the retest candle, target the next major level
- Avoid chasing — if you missed the breakout, wait for the retest
A practical example: GBP/USD has been capped at 1.2700 for six weeks. On a Thursday afternoon following positive UK employment data, price closes above 1.2700 on three times average volume. It then pulls back to test 1.2700 from above. That retest is your entry — breakout confirmed, role reversal playing out in real time.
Advanced Tips to Sharpen Your Support and Resistance Analysis
Once you have the fundamentals down, these advanced techniques will help you refine your analysis and find higher-probability setups consistently.
- Combine with Fibonacci retracements. When a Fibonacci level (38.2%, 50%, or 61.8%) aligns with a horizontal support/resistance zone, the confluence dramatically increases the probability of a reaction.
- Watch the 50 and 200-period moving averages. These dynamic levels often align with horizontal S&R zones and add another layer of confirmation.
- Use the Weekly open price. Professional forex traders heavily reference the weekly open as a key level throughout the trading week — it often acts as a magnet or barrier for price.
- Pay attention to round numbers. Currency pairs consistently gravitate toward and react at psychologically significant levels like 1.1000, 1.2500, and 1.3000. Banks and institutions place large orders at these levels.
- Do not trade in isolation. Support and resistance analysis is most powerful when combined with trend analysis. Trading a bounce at support is higher probability when the broader trend is bullish. Always have context.
- Journal every S&R trade. Over time, reviewing your trades will reveal which level types work best for your style and which setups you tend to misread. This personalized data is more valuable than any textbook.
Frequently Asked Questions
Conclusion: Your Chart Is Telling a Story — Learn to Read It
Support and resistance are not complicated concepts, but they are endlessly nuanced in how they play out across different pairs, timeframes, and market conditions. The traders who profit consistently are not those with the most sophisticated indicators or algorithms. They are the ones who have internalized where price tends to react and why — and who execute with discipline when those moments arrive.
Start simple. Pick one pair, one timeframe, and practice identifying three to five major levels per week. Watch how price behaves when it approaches those zones. Does it bounce? Does it break and retest? Does it fake out and reverse? Over time, the patterns become familiar, and your decision-making becomes faster and more confident.
Support and resistance are not a magic formula — but paired with solid risk management, market context, and your own evolving judgment, they are one of the most powerful tools any forex trader can master.
Ready to Trade Smarter?
Join thousands of forex traders who rely on fxTsignals.com for daily signals, expert analysis, and real-time support and resistance levels — so you never trade blind again.
Explore Signal Service Explore Copy Trading Service