Mastering the ADX Indicator: The Forex Trader's Guide to Reading Trend Strength Like a Pro
Stop guessing whether a trend is real. The Average Directional Index tells you exactly how strong the market is moving — and when to stay out of the noise.
Why Most Forex Traders Miss the Most Obvious Clue in the Market

Every experienced forex trader has been there — you enter a trade convinced the market is about to surge, and then it goes absolutely nowhere. The chart wiggles sideways. Your stop loss gets hit. You close at a loss and wonder what you missed.
What you likely missed wasn't the direction — it was the strength. A market can be technically pointing upward while barely moving at all. That's the difference between a trend and a drift, and it's where the Average Directional Index (ADX) becomes your most honest trading companion.
In this guide, we'll break down everything you need to know about the ADX — how it works, how to read it correctly, how to combine it with other tools, and most importantly, how to use it to make smarter, more confident trading decisions on platforms you already use at fxTsignals.com.
"The ADX doesn't just point in a direction — it tells you whether that direction actually means something. That's a distinction worth thousands of pips."
What Exactly Is the Average Directional Index (ADX)?
The Average Directional Index was created by the legendary technical analyst J. Welles Wilder Jr. in 1978, introduced in his landmark book New Concepts in Technical Trading Systems. Wilder also gave traders the RSI and Parabolic SAR, so the ADX is in excellent company.
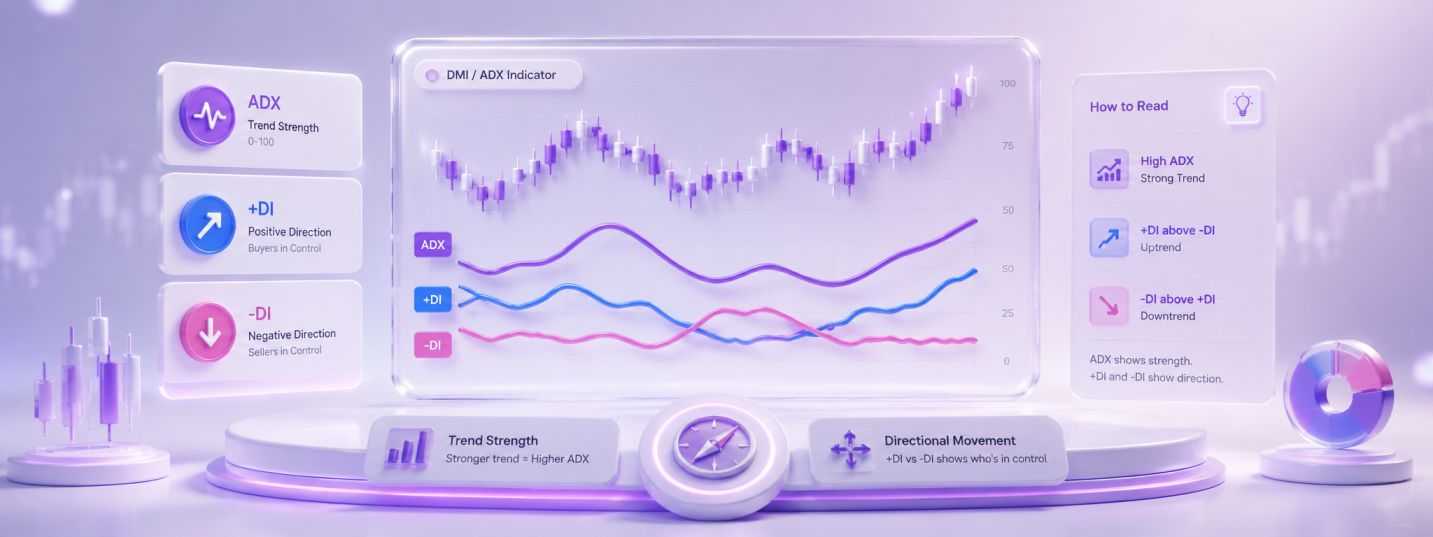
The ADX measures trend strength — not direction. This is a crucial distinction. A high ADX value simply means the market is moving with conviction, whether that's up or down. The direction component comes from its companion lines, the Directional Movement Indicators.
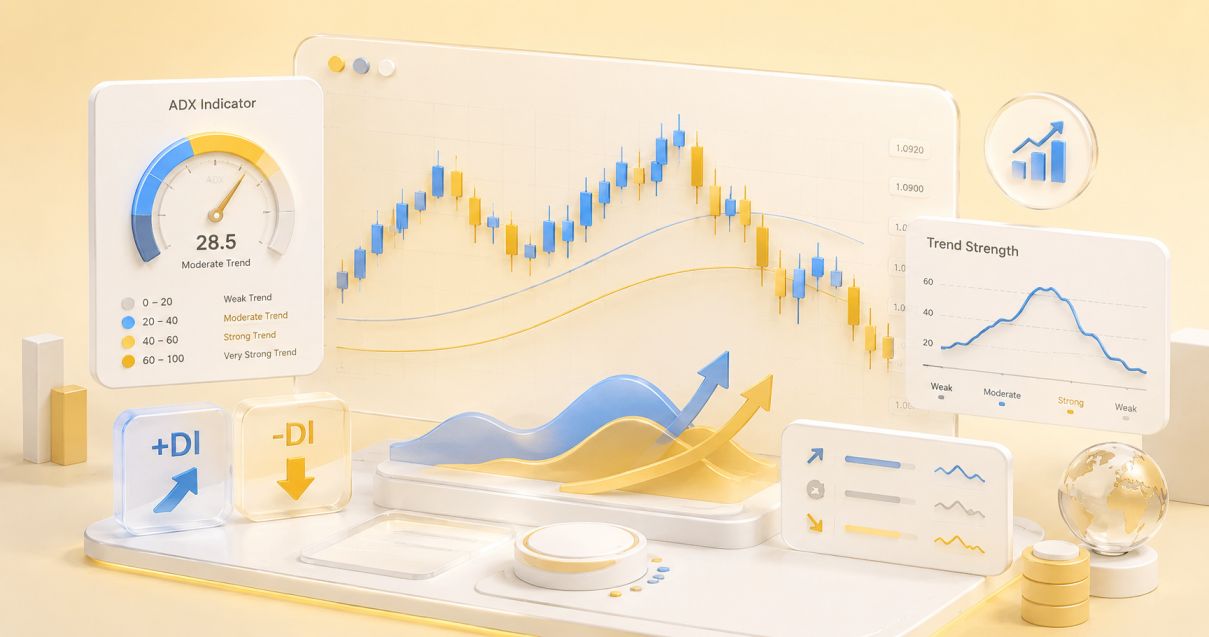
The Three Components of ADX
Most charting platforms display ADX as a system of three lines:
- ADX Line — The main line. Shows how strong the current trend is, regardless of direction. Ranges from 0 to 100.
- +DI (Positive Directional Indicator) — Measures upward price movement. When this is dominant, buyers are in control.
- −DI (Negative Directional Indicator) — Measures downward pressure. When this leads, sellers are driving the market.
Together, these three lines paint a complete picture: how strong the market is, and which side — bulls or bears — currently has the edge.
How to Read ADX Values: A Practical Breakdown
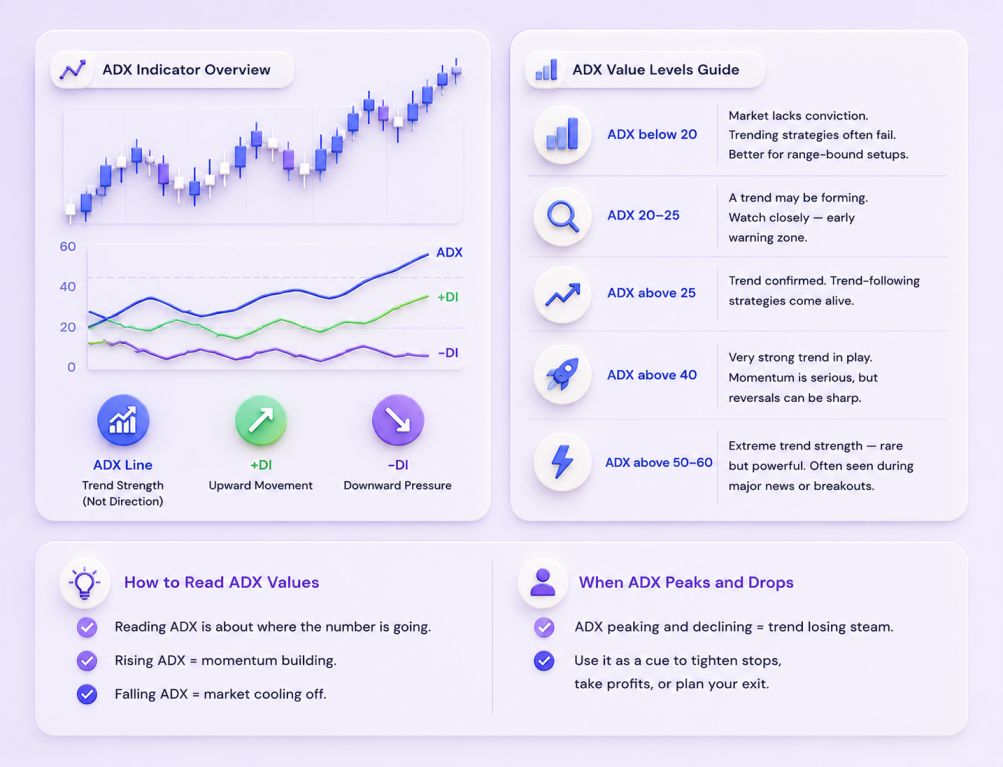
Reading ADX correctly is less about the number itself and more about where the number is going. A rising ADX means momentum is building. A falling one means the market is cooling off, even if price is still moving.
Here's a quick reference that most professional traders use:
- ADX below 20: The market lacks conviction. Trending strategies often fail here. Better suited for range-bound approaches.
- ADX 20–25: A trend may be forming. Watch closely — this is the early warning zone.
- ADX above 25: Trend confirmed. This is where trend-following strategies come alive.
- ADX above 40: Very strong trend in play. Momentum is serious, but reversals can be sharp when they come.
- ADX above 50–60: Extreme trend strength — rare, but powerful. Often seen during major news events or breakouts.
What Happens When ADX Peaks and Drops?
One of the most useful signals the ADX gives is when it peaks and begins declining. This doesn't necessarily mean the price reverses immediately — but it does mean the trend is losing steam. Savvy traders use this as a cue to tighten stop losses, take partial profits, or start looking for the exit.
Think of it like a car engine. The ADX tells you how hard the engine is running. When it starts easing back, the car isn't stopping — but it's slowing down. Smart drivers adjust accordingly.
Understanding +DI and −DI: Where the Direction Comes In
While the ADX line tells you about trend strength, the +DI and −DI lines tell you about trend direction. Used together, they create a powerful signal framework many professional traders rely on daily.
The Classic DMI Crossover Signal
The most well-known entry signal using the ADX system involves watching for crossovers between the +DI and −DI lines:
- When the +DI crosses above the −DI, and the ADX is rising above 25, it's considered a bullish signal — a potential long entry.
- When the −DI crosses above the +DI, with ADX confirming strength, it signals a bearish move — a potential short entry.
Pro tip: Never trade a DMI crossover in isolation. Only act when the ADX line is above 25 and ideally rising. A crossover during a flat, sub-20 ADX is a false signal more often than not.
This combination effectively filters out the noise that kills accounts — trading in low-conviction environments where spreads eat your profits and markets go nowhere.
How to Build Real Trading Strategies Using ADX
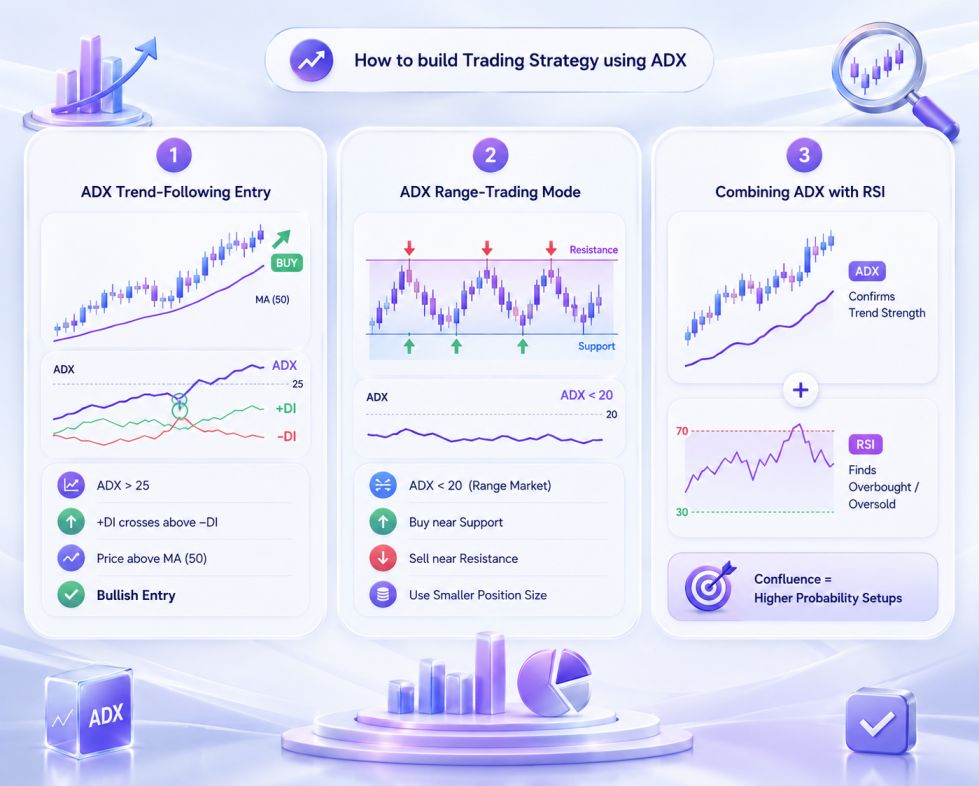
Strategy 1: ADX Trend-Following Entry
This is the most straightforward application. Wait for the ADX to rise above 25 — this confirms a trend is forming. Then use the +DI/−DI crossover as your entry trigger. Many traders also add a moving average (such as the 50 EMA) to align trade direction with the broader market trend.
Example setup on EUR/USD (H4 chart):
- ADX rises from 18 to 28, crossing the 25 threshold.
- +DI crosses above −DI while ADX is rising.
- Price is above the 50 EMA — confirming bullish bias.
- Enter long, stop loss below the recent swing low.
Strategy 2: ADX Range-Trading Mode
When ADX drops below 20 and flattens, the market is effectively ranging. This is not the time for breakout trades — it's the time for support and resistance plays. Traders using fxTsignals.com signals benefit here because ranging markets offer clean bounces at key levels when the signals align.
During low-ADX periods:
- Identify clear horizontal support and resistance zones.
- Look to buy near support, sell near resistance.
- Keep position sizes smaller — range breakouts can be sudden.
- Exit before price approaches the opposite boundary.
Strategy 3: Combining ADX with RSI for Confluence
ADX tells you if a trend exists. RSI tells you whether it's overextended. Together, they create a powerful combination. A strong ADX reading (above 30) combined with an RSI that is not at extremes suggests there's still room for the trend to run. When RSI is overbought or oversold AND ADX is fading — that's often a reliable exit signal.
The Feature Most Traders Ignore: ADX in Sideways Markets
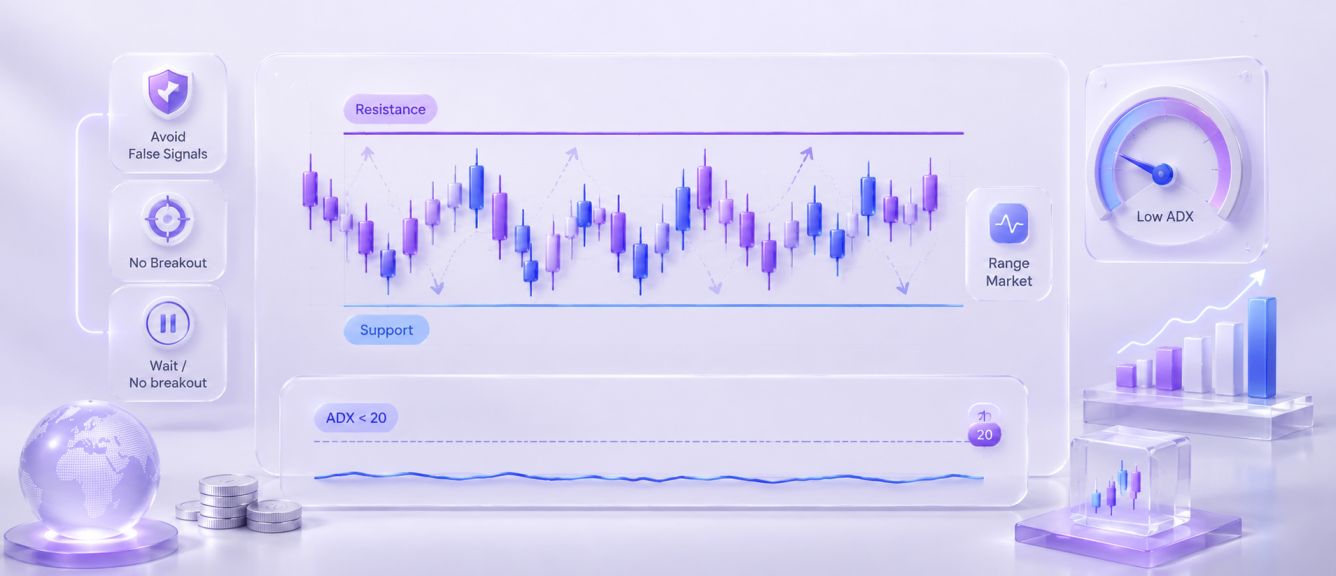
Most indicators become liabilities in non-trending markets. Moving average crossovers give false signals. MACD flips constantly. But the ADX actually becomes more useful in flat markets — because its job is to tell you when there's nothing worth trading.
A flat ADX below 20 is one of the most valuable signals in forex. It says: "Stand down. The market is in consolidation. Wait."
Traders who respect this signal avoid a huge percentage of losing trades. The willingness to sit on your hands while ADX is flat is a skill that separates consistently profitable traders from those who feel compelled to always be in the market.
Discipline is not about catching every move. It's about only trading when the conditions genuinely favor you. ADX below 20? That's your cue to step back and wait for the market to show its hand.
7 Practical ADX Tips Every Forex Trader Should Know
- Always check ADX before entering a trend trade. If it's below 20, the trend is not confirmed. Wait.
- Watch for ADX slope, not just value. A rising ADX at 22 is more bullish than a falling ADX at 30.
- Use ADX on higher timeframes first. H4 or Daily ADX gives you the macro trend context. Then drop to H1 for entry timing.
- Don't use ADX alone. Combine it with RSI, moving averages, or support/resistance for higher-probability setups.
- Set a default period of 14. This is Wilder's original setting and remains the most widely used. Changing it can make the indicator too fast (noisy) or too slow (lagging).
- Use low ADX as a consolidation alert. Market breakouts often follow extended periods of very low ADX — when it starts rising sharply from below 15, a big move may be coming.
- Combine with volume data where possible. A rising ADX accompanied by increasing volume gives much stronger confirmation of a real trend versus a low-volume drift.
Frequently Asked Questions About ADX
Final Thoughts: Let ADX Filter Out the Noise
The forex market is one of the most dynamic financial environments in the world. It rewards patience, precision, and the ability to tell the difference between real movement and meaningless noise. The Average Directional Index is one of the most honest tools you have for that exact purpose.
Use it to confirm trends before committing capital. Use it to recognize when the market is flat and your energy is better spent waiting. Use it alongside other indicators to build setups with real confluence. And use the signals available at fxTsignals.com to supercharge your decision-making with professional-grade analysis.
The traders who consistently make money in forex aren't those who trade the most. They're the ones who trade the right moments — and the ADX is one of the best tools ever created for identifying exactly when those moments arrive.
For more expert forex trading guides, indicator breakdowns, and live signals, visit www.fxTsignals.com.
Ready to Trade With an Edge?
Join thousands of forex traders who rely on fxTsignals.com for precise, real-time trading signals powered by professional technical analysis — including ADX-based setups.
Explore Copy Trading →