Forex Analysis Masterclass: How Smart Traders Actually Decode the Market
Stop guessing. Start trading with clarity. Your no-fluff guide to technical and fundamental forex analysis — built for every level of trader.
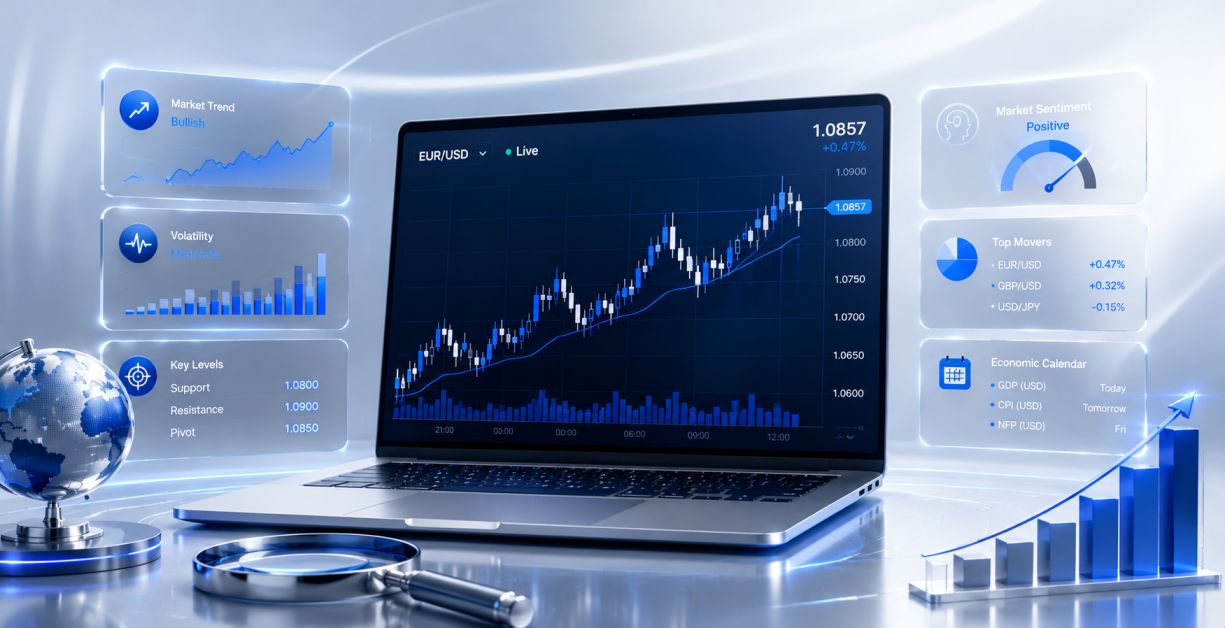
Forex trading is one of the most exciting financial markets in the world — and one of the most unforgiving. Every day, trillions of dollars flow between currencies, moved by data releases, central bank decisions, geopolitical events, and the collective psychology of millions of traders. To navigate this environment successfully, you need more than gut instinct. You need forex analysis.
Whether you're just starting out or you've been trading for years, understanding how to properly analyze the forex market separates the consistent winners from those who keep blowing their accounts. This guide breaks it all down: what forex analysis actually means, the two core approaches every trader must know, the tools that make your life easier, and how to build a system that works for you at fxTsignals.com.
Understanding the Forex Market — The Playing Field

The foreign exchange market — commonly known as forex or FX — is where currencies are bought and sold. It operates over-the-counter (OTC), meaning there's no central exchange. Instead, it runs through a global network of banks, brokers, and institutions, open 24 hours a day, five days a week.
What makes forex unique is its sheer scale and liquidity. With over $7.5 trillion traded daily, it dwarfs every other financial market. Price movements happen fast, and opportunities arise constantly — but so do risks.
Key Players You Should Know
Understanding who moves the market helps you anticipate where prices might go. The major participants include:
- Central Banks — They control monetary policy and interest rates, making them the most powerful market movers (think the Fed, ECB, or Bank of England)
- Commercial Banks — They facilitate currency transactions for corporate clients and manage their own trading books
- Hedge Funds — Large institutional players that take massive speculative positions
- Multinational Corporations — They convert currencies for international business operations
- Retail Traders — That's you and me, trading through platforms like MetaTrader or TradingView
Each of these players affects supply and demand for different currency pairs. When a central bank raises interest rates, for example, its currency typically strengthens — creating real trading opportunities for those paying attention.
Fundamental Analysis — Reading the Economy's Pulse

Fundamental analysis is about understanding the why behind price movements. Instead of looking at price charts, you're examining the economic and geopolitical forces that drive currency values. This type of analysis answers the big question: Is this currency worth more or less than it currently trades for?
Key Economic Indicators to Watch
These are the data points that move markets. Mark them on your economic calendar and trade around them with care:
GDP (Gross Domestic Product)
GDP measures a country's total economic output. A growing GDP signals a healthy economy, which typically strengthens the currency. When the US reports better-than-expected GDP figures, USD pairs often react sharply.
Inflation Rates (CPI & PPI)
Inflation data directly influences central bank rate decisions. Higher inflation often leads to rate hikes, which attract foreign capital and push the currency higher.
Interest Rate Decisions
Perhaps the most powerful single driver in forex. When the Fed raises rates, USD strengthens. When the ECB cuts, EUR typically weakens. Follow rate decisions religiously.
Employment Data (Non-Farm Payrolls)
The US NFP report, released the first Friday of every month, is one of the most volatile events in forex. Strong job numbers indicate economic health and usually boost the dollar.
Geopolitical Events and Market Sentiment
Beyond the numbers, geopolitical events — elections, trade wars, natural disasters — can shake currency pairs violently. The 2022 Russia-Ukraine conflict sent the Euro tumbling while the Swiss Franc surged as a safe haven. Understanding these macro narratives keeps you on the right side of the market.
Market sentiment — the collective mood of traders — is equally important. If traders feel risk-averse, they pile into safe havens like JPY and CHF. If sentiment is bullish, they chase higher-yielding currencies. Tools like the COT (Commitment of Traders) report help you gauge this sentiment professionally.
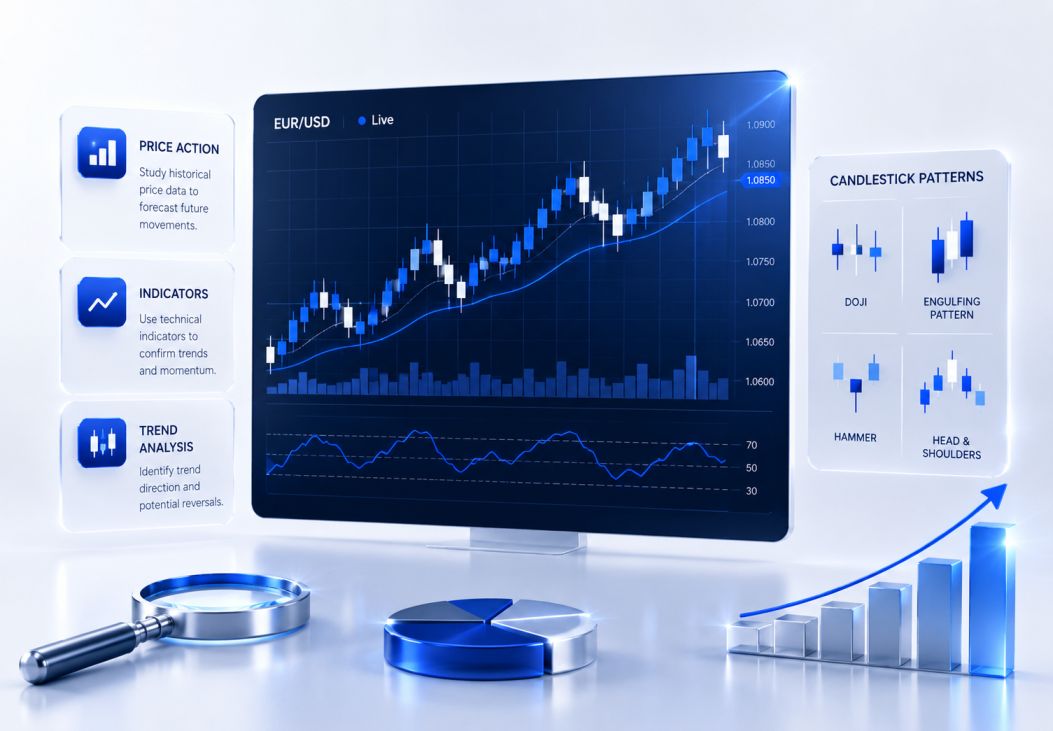
Technical Analysis — Letting the Chart Tell the Story
While fundamental analysis tells you what to trade, technical analysis tells you when to trade. It involves studying historical price data — through charts, patterns, and indicators — to forecast where prices are likely to go next. Most professional traders use a blend of both approaches.
Price Charts and Candlestick Patterns
The candlestick chart is the trader's best friend. Each candle shows four key prices: open, high, low, and close. Over time, patterns form that signal potential reversals or trend continuations:
- Doji — Signals market indecision; often a precursor to a reversal
- Engulfing Pattern — A strong reversal signal when a candle completely engulfs the previous one
- Hammer / Shooting Star — Indicates rejection of lower/higher prices; great entry signal
- Head and Shoulders — A classic reversal pattern from bullish to bearish trend
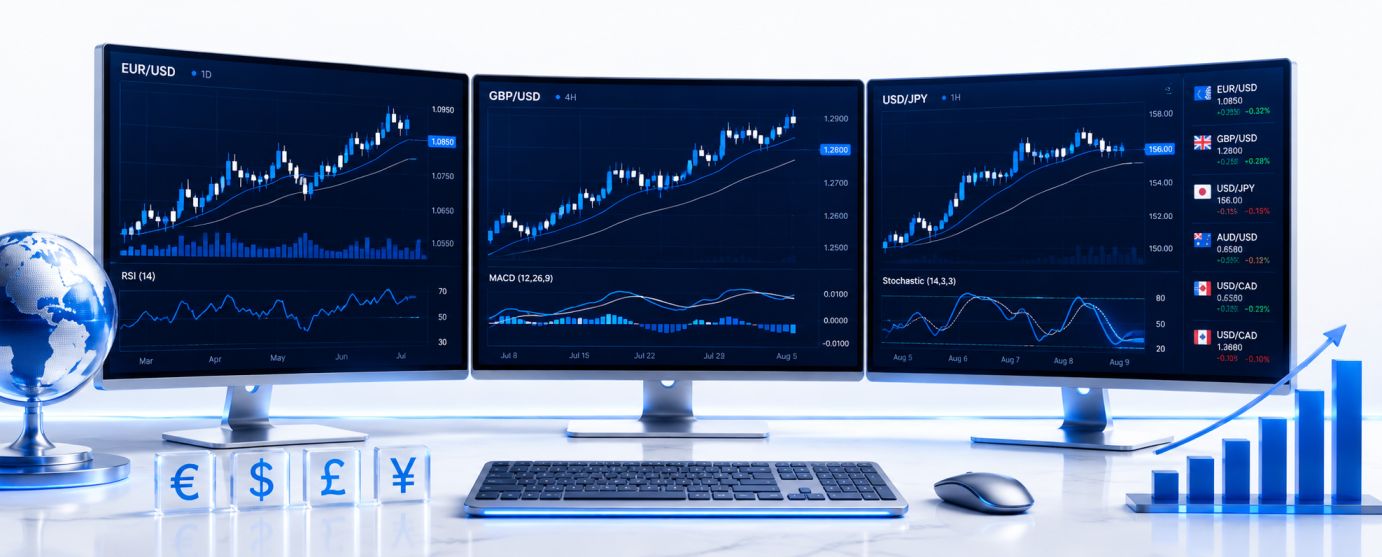
Technical Indicators Every Trader Should Use
Moving Averages (MA)
The 50 and 200-period moving averages are widely watched. A "golden cross" (50 MA crossing above 200 MA) is a strong bullish signal. A "death cross" is bearish. They smooth out price noise and reveal the underlying trend direction.
Relative Strength Index (RSI)
RSI measures momentum on a scale of 0–100. Above 70 suggests overbought conditions (price may fall), below 30 suggests oversold (price may rise). Use it to time entries after a trend is confirmed.
MACD (Moving Average Convergence Divergence)
MACD signals momentum shifts by measuring the relationship between two moving averages. When the MACD line crosses the signal line upward, it's a buy signal. A downward cross suggests selling pressure is building.
Bollinger Bands
These volatility bands expand and contract around price. When price touches the upper band, the market may be overbought. When it touches the lower band, it may be oversold. Particularly useful in ranging market conditions.
Support and Resistance — The Foundation of Every Trade
Support and resistance levels are price zones where buying or selling pressure is historically strong. These are the building blocks of every good trade. When price approaches a known support level, it's often a solid area to look for long entries. Resistance levels signal where sellers may step in aggressively.
Combine these with candlestick patterns and indicator confirmation, and you have a powerful, repeatable entry strategy.
Building Your Forex Analysis Toolkit
Having the right tools doesn't guarantee success, but trading without them is like navigating without a map. Here's what every serious forex trader should have in their toolkit:
- MetaTrader 4/5 — Industry-standard platform for charting, automated strategies (Expert Advisors), and executing trades
- TradingView — Superb for multi-timeframe analysis, community ideas, and clean chart layouts
- Economic Calendar — Sites like Forex Factory or Investing.com provide real-time schedules of key data releases
- COT Reports — Track institutional positioning to understand where the "smart money" is placing bets
- News Feeds — Reuters, Bloomberg, and ForexLive offer fast-breaking market news
The goal isn't to use every tool available — it's to build a clean, distraction-free workflow that supports your specific trading strategy. Less is often more when it comes to chart setups.
Risk Management — The Skill That Keeps You in the Game
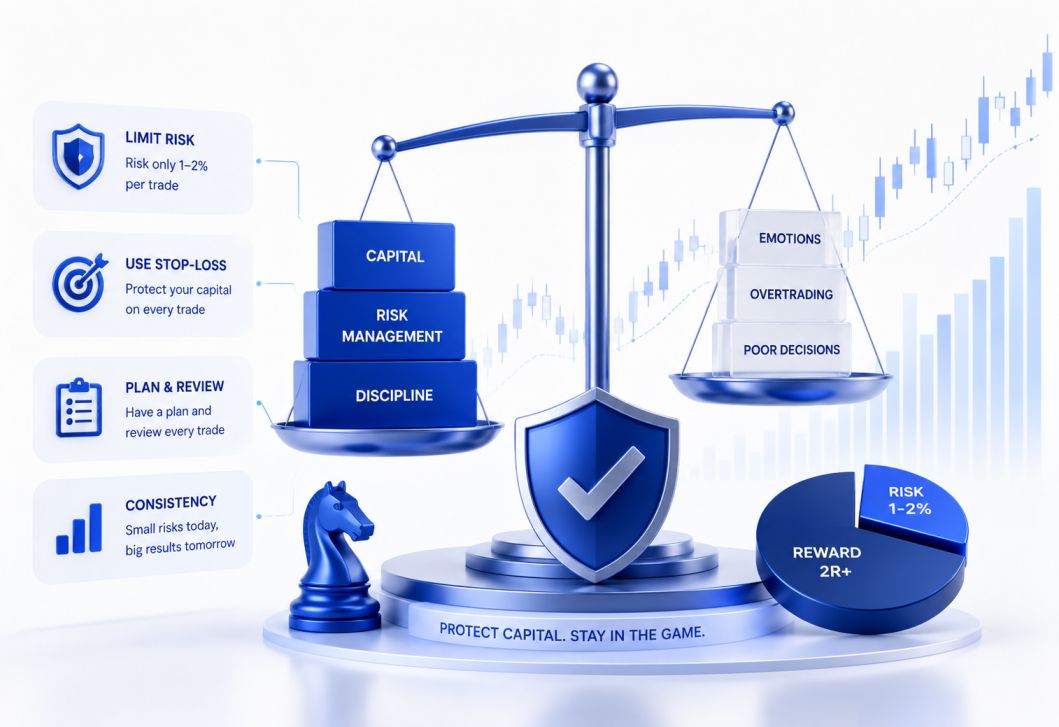
Even the most accurate analysis means nothing without solid risk management. This is the skill that separates hobbyists from professionals. The market can and will move against you — the question is how much damage it does when it does.
Practical Risk Management Tips
- Never risk more than 1–2% of your account on any single trade
- Always use a stop-loss order — no exceptions, no "I'll watch it manually"
- Aim for a minimum 1:2 risk-to-reward ratio — if you risk $50, target at least $100 profit
- Avoid overtrading; quality setups over quantity every single time
- Keep a trading journal — document every trade, your reasoning, and the outcome
Think of risk management not as limiting your gains, but as protecting your ability to keep trading. A 50% drawdown requires a 100% gain just to break even. Protecting your capital is the first rule of forex trading.
Developing Your Trading Plan — The Blueprint for Consistency
A trading plan is a written document that defines your approach to the market. Without one, you're making emotional, ad-hoc decisions that rarely lead to sustainable profits. Your trading plan should cover:
What to Include in Your Trading Plan
- Your preferred currency pairs and trading sessions (London, New York, Asian)
- The analysis method you use — technical, fundamental, or a blend
- Entry and exit rules with clear criteria (e.g., "Enter on RSI below 35 + bullish engulfing at support")
- Risk per trade and maximum daily drawdown limit
- How and when you'll review and refine your strategy
Treat your trading plan like a professional contract with yourself. Stick to it even when emotions push you to deviate. The best traders aren't those who take the most trades — they're those who wait patiently for their setup and execute with discipline.
Frequently Asked Questions
Everything forex traders ask us most often — answered clearly.
Conclusion — Analysis is the Edge You've Been Missing
The forex market rewards those who prepare. It punishes those who trade on impulse, hope, or half-baked strategies. Whether you're leaning toward fundamental analysis, technical analysis, or a powerful combination of both, the key is to build a structured, repeatable process — and stick to it.
Remember: great trades aren't born from hot tips or lucky guesses. They're built through patient analysis, disciplined risk management, and the willingness to keep learning. Start with the basics, master them, and gradually expand your toolkit. Your consistency will compound over time.
The traders who win long-term aren't necessarily the smartest in the room. They're the most disciplined, the most prepared, and the ones who treated trading as a craft worth mastering.
Join thousands of traders who rely on fxTsignals.com for daily forex signals, in-depth analysis, and market-moving insights delivered straight to you.
Join Automated Trading →