Forex trading is not a guessing game — at least not for the traders who consistently come out ahead. The difference between those who win over the long term and those who don't often comes down to one thing: how well they read the market. And reading the market means mastering technical analysis.
In this guide, we're going beyond the basics. We'll break down three of the most powerful and widely-used advanced technical analysis tools available to forex traders: Fibonacci Retracement, the Ichimoku Cloud, and Bollinger Bands. Each of these tools offers a completely different lens through which to view price action — and when used together, they can form the backbone of a seriously robust trading strategy.
Whether you've been trading forex for years or you're just hitting your stride, what follows will give you actionable knowledge you can apply to your charts right now.
1. Fibonacci Retracement — Reading the Hidden Rhythm of Markets
Here's something most traders don't fully appreciate until they've seen it over and over again: the forex market doesn't move in straight lines. It surges, pulls back, then resumes. That pull-back? That's where Fibonacci retracement comes in — and it's remarkably good at predicting exactly how far that pull-back will go.
Fibonacci retracement is rooted in a mathematical sequence that appears throughout nature — the same one you'll find in seashells, sunflowers, and galaxy formations. Leonardo Fibonacci discovered that each number in the sequence relates to the one before it in a ratio that keeps showing up in financial markets too.
"Fibonacci retracement levels act as hidden lines of support and resistance, helping traders pinpoint potential reversal zones within a larger trend before price even gets there."
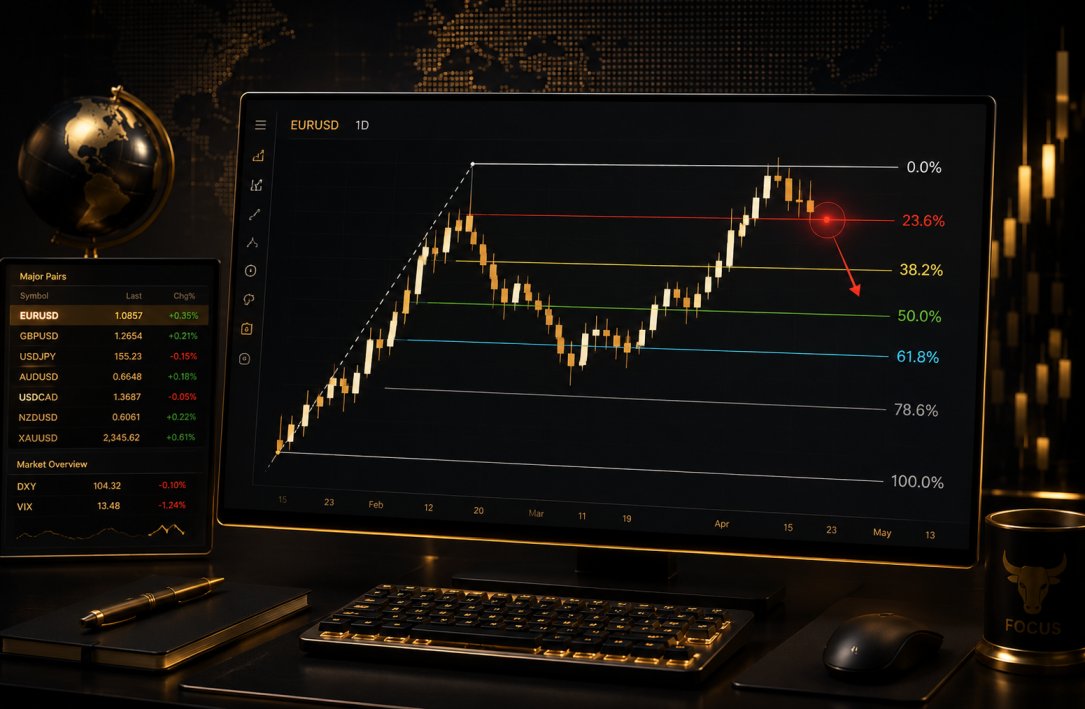
The Key Levels You Need to Know
The standard Fibonacci levels used in forex are:
- 23.6% — A shallow pullback; often seen in very strong trends.
- 38.2% — A moderate retracement; one of the most watched levels.
- 50.0% — Not a "true" Fibonacci number, but widely respected by traders.
- 61.8% — The "golden ratio." Arguably the most important level of all.
- 78.6% — Deeper retracement; used by traders watching for trend exhaustion.
Applying It in Practice
To draw a Fibonacci retracement on your chart, identify a clear swing high and a swing low — the beginning and end of a significant price move. Your charting software will then plot those percentage levels between those two points automatically.
For example, if EUR/USD moves from 1.0800 (swing low) to 1.1000 (swing high), the 61.8% retracement would sit around the 1.0876 level. If price pulls back toward that zone and shows signs of holding — a bullish candlestick pattern, increased volume, confluence with a moving average — that becomes a high-probability area to consider going long.
Pro Tip: Fibonacci levels become significantly more powerful when they align with other technical analysis tools — like a 200-period moving average or a key horizontal support level. These confluences create what traders call "high probability zones."
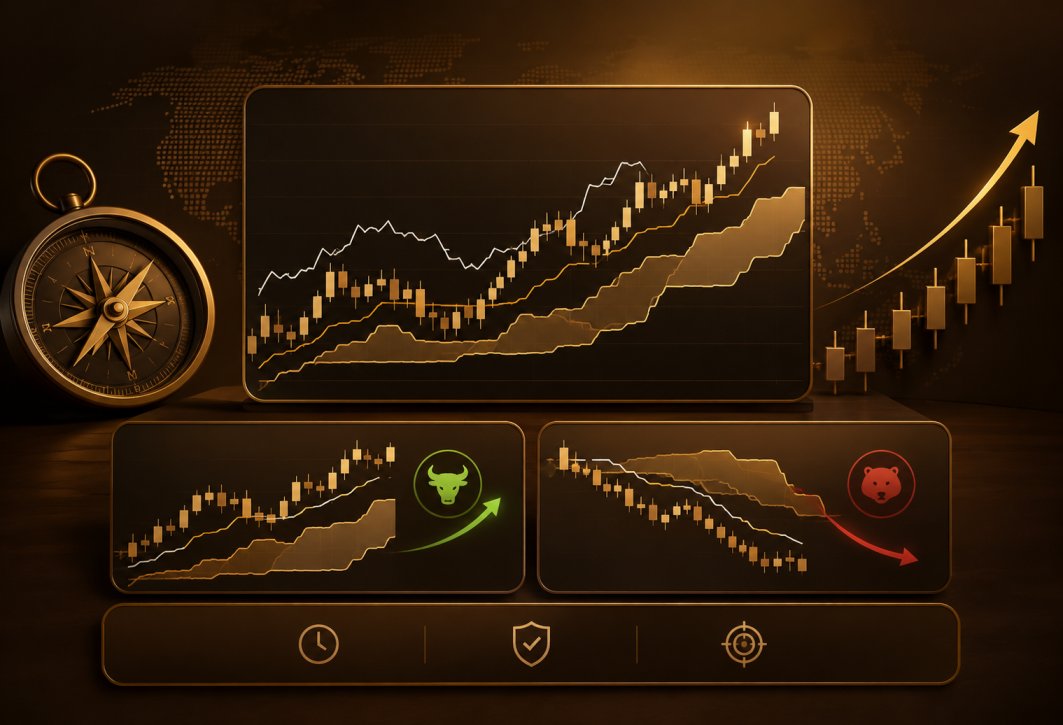
2. The Ichimoku Cloud — Your All-in-One Market Compass

If Fibonacci tells you where price might pause, the Ichimoku Cloud tells you everything else. Trend direction, momentum, support and resistance, and even potential entry signals — all from one indicator. It looks complex at first, but once you understand what each component does, it becomes one of the most elegant tools in all of technical analysis.
Developed by Japanese journalist Goichi Hosoda in the late 1960s, the Ichimoku Cloud (Ichimoku Kinko Hyo) was designed to give traders a complete picture of price dynamics in a single glance. And it delivers.
Breaking Down the Five Components
Average of the highest high and lowest low over the past 9 periods. Provides short-term trend direction and momentum signals.
Same calculation over 26 periods. A medium-term trend indicator and widely used as a dynamic support/resistance level.
Average of Tenkan-Sen and Kijun-Sen, plotted 26 periods forward. Forms the first boundary of the cloud (Kumo).
Average of highest high and lowest low over 52 periods, projected 26 periods forward. Thicker clouds mean stronger support/resistance.
The current closing price plotted 26 periods back in time. Used to confirm trend direction by comparing current price to where it was 26 bars ago.
"The cloud doesn't just show you support and resistance — it shows you the strength of it. A thick cloud is hard to break through; a thin one signals potential weakness."
How to Read the Signals
The golden rule with Ichimoku is simple: price above the cloud is bullish; price below the cloud is bearish. When price is inside the cloud, the market is ranging and signals are less reliable — a cue to wait or reduce position size.
The most reliable buy signal comes when the Tenkan-Sen crosses above the Kijun-Sen (the "TK Cross"), price is above the cloud, and the Chikou Span is above price from 26 periods ago. When all three align, the probability of a successful long trade rises substantially.
Conversely, a bearish TK cross below the cloud, confirmed by the Chikou Span sitting below historic price, is one of the cleanest short signals the Ichimoku system produces.
Many professional traders use the Kijun-Sen (Base Line) as a trailing stop. Because it dynamically adjusts with price action, it keeps you in winning trades longer while still protecting profits.
Pro Tip: The Ichimoku Cloud works best on higher time frames — the H4 and daily charts in particular. On shorter timeframes, the signals can be choppy. Stick to the bigger picture for cleaner reads.
3. Bollinger Bands — Mastering Volatility Like a Pro
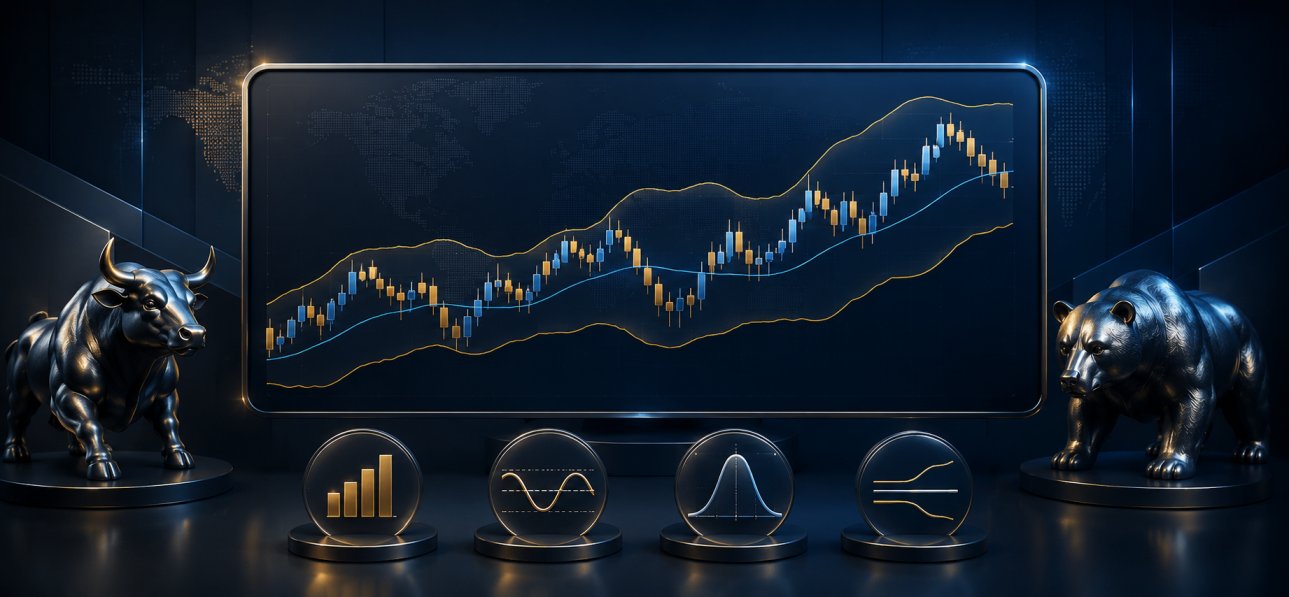
If there's one thing that separates consistent traders from emotional ones, it's an understanding of volatility. Markets breathe — they expand and contract. Bollinger Bands, created by technical analysis legend John Bollinger, are specifically designed to show you exactly where you are in that cycle.
The indicator consists of three lines: a middle band (typically a 20-period simple moving average), an upper band (the SMA + 2 standard deviations), and a lower band (the SMA − 2 standard deviations). As volatility increases, the bands widen; as volatility contracts, they squeeze together.
The Bollinger Band Squeeze — Catching Big Moves Early
One of the most exciting setups in technical trading is the Bollinger Squeeze. When the bands compress to unusually tight levels, it signals that the market is coiling up. Think of it like a spring being compressed — at some point, it has to release. And when it does, the move is often explosive.
The squeeze itself doesn't tell you which direction the breakout will go. That's where other tools — like the direction of the Ichimoku trend or a key Fibonacci level — help you anticipate the most likely outcome.
"Low volatility always precedes high volatility. The Bollinger Squeeze is your early warning system — it tells you to get ready, even before the market makes its move."
Three Core Bollinger Band Strategies
- Bollinger Band Breakout: When price closes decisively above the upper band or below the lower band after a squeeze, it often signals the start of a new trend. Entry on the candle close, stop behind the band, trailing as the move develops.
- Mean Reversion (Band Touch): In ranging markets, price tends to revert to the 20 SMA (middle band) after touching the outer bands. Especially effective when combined with overbought/oversold RSI readings.
- Bandwidth Monitoring: Tracking the distance between the upper and lower bands lets you gauge whether a market is becoming more or less volatile over time — useful for deciding between trend-following and mean-reversion approaches.
Putting It All Together — A Multi-Indicator Approach
The real edge in technical analysis comes from confluence. Individually, each of these three tools is powerful. But when they start pointing in the same direction, you get something special.
Imagine this scenario on the EUR/USD daily chart: Price has been in a clear uptrend above the Ichimoku Cloud. It pulls back and finds support right at the 61.8% Fibonacci level. At the same time, Bollinger Bands are showing a squeeze that's just starting to resolve to the upside. A TK Cross triggers above the cloud. The Chikou Span is clear of historic price.
Every major tool is confirming the same thing. That's not luck — that's methodology. That's how consistent traders find high-quality setups, manage risk with precision, and stay in winning trades for maximum return.
Conclusion — From Knowledge to Consistent Execution
Fibonacci retracement, the Ichimoku Cloud, and Bollinger Bands are not magic bullets. No single indicator is. But they are the tools that serious, disciplined forex traders return to again and again — because when used with patience and proper risk management, they deliver.
The path forward is clear: study each tool individually until you understand it deeply, then practice applying them together on demo charts before trading real capital. Build your confluence-based system. Test it. Refine it. Trust the process.
At fxTsignals.com, we believe every trader deserves the tools, signals, and education to trade with genuine confidence. The techniques you've read about today are the very ones our team of analysts uses daily. Now they're in your hands.
Frequently Asked Questions
Everything forex traders ask about advanced technical analysis
The 61.8% level — often called the "golden ratio" — is widely considered the most significant. It derives directly from the Fibonacci sequence and appears most frequently in strong trends. However, the 38.2% level is also extremely reliable in fast-moving, high-momentum markets. Smart traders watch all levels but give extra weight to 61.8% and its confluence with other indicators.
The Ichimoku Cloud has a learning curve, but that shouldn't put beginners off. Start by learning just one component at a time — begin with the cloud itself to understand trend direction and dynamic support/resistance. Once that clicks, add the TK Cross and Chikou Span. Within a few weeks of consistent study, the whole system starts to feel intuitive.
A simple moving average tells you the average price over a defined period — that's it. Bollinger Bands take the SMA as their foundation but add statistical volatility bands above and below it, using standard deviations. This means Bollinger Bands dynamically adjust to market conditions in real time, widening during high-volatility periods and tightening when the market quiets. They give you both a trend reference and a volatility gauge in one tool.
Absolutely — and this is where serious traders find their edge. Fibonacci retracement helps identify entry zones; the Ichimoku Cloud confirms trend direction and provides dynamic support/resistance; Bollinger Bands reveal volatility context and breakout timing. When all three converge on the same signal, the probability of a successful trade increases meaningfully. This multi-confluence approach is the cornerstone of professional technical analysis.
Each indicator performs best on medium-to-higher timeframes. Ichimoku is most reliable on H4 and Daily charts, where the noise is filtered out. Fibonacci retracement is effective across all timeframes but provides the cleanest levels on H1 and above. Bollinger Bands work well on H1 through Daily charts for both swing and trend trading. Shorter timeframes (M1–M15) tend to generate more false signals with all three tools.
Ready to Trade with Precision and Confidence?
Join thousands of traders who rely on fxTsignals.com for professional-grade signals, in-depth analysis, and strategies that actually perform in live markets.
Get Premium Signals Now →