Master Every Time Frame in Forex Trading — From M1 Scalping to MN Long-Term
Whether you're a fast-paced scalper chasing micro-moves or a patient investor riding multi-year cycles, the time frame you trade on shapes everything — your entries, your risk, and your results.
Why Time Frames Are the Foundation of Every Forex Strategy
Most traders obsess over indicators, news events, and trade setups — but overlook the single variable that ties everything together: their chosen time frame. The same currency pair, the same moment in time, can tell completely different stories depending on whether you're looking at a 1-minute chart or a monthly one.
Think of it this way. A weather app showing the next hour will tell you whether to grab an umbrella. A seasonal forecast tells you whether to book a beach holiday. Both are accurate — they just answer different questions. Trading time frames work exactly the same way.
In this guide, we're breaking down every major time frame used by forex traders worldwide — from the lightning-fast M1 to the sweeping monthly MN — so you can match the right lens to your personality, schedule, and goals.

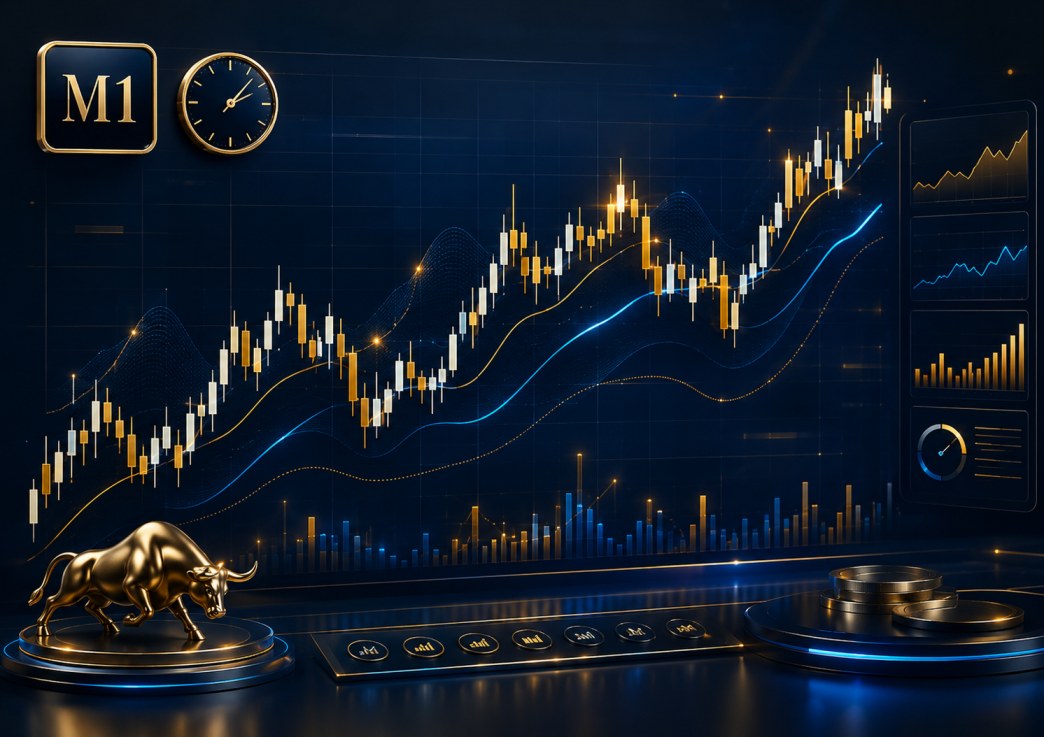
M1 — The Scalper's Playground
The M1 chart is where forex trading gets its heartbeat. Every single candle represents just 60 seconds of price action, making it the go-to tool for scalpers who live and breathe on the razor's edge of the market.
Trading on this time frame isn't for the faint-hearted. You'll be making decisions in seconds, managing risk in real time, and exiting positions before most traders even finish reading a candlestick pattern. The upside? Multiple opportunities every session, and small but consistent gains that stack up fast.
Who Should Trade the M1?
- Full-time traders who can dedicate uninterrupted screen time during high-liquidity sessions (London and New York opens)
- Traders with iron discipline in risk management — tight stops are essential since a few pips can mean the difference between profit and loss
- Those looking to exploit bid-ask spreads and short-lived momentum bursts around major news events
Always pair M1 with an M15 chart for context. Scalping against the intraday trend on M15 is one of the fastest ways to lose money on a 1-minute chart.
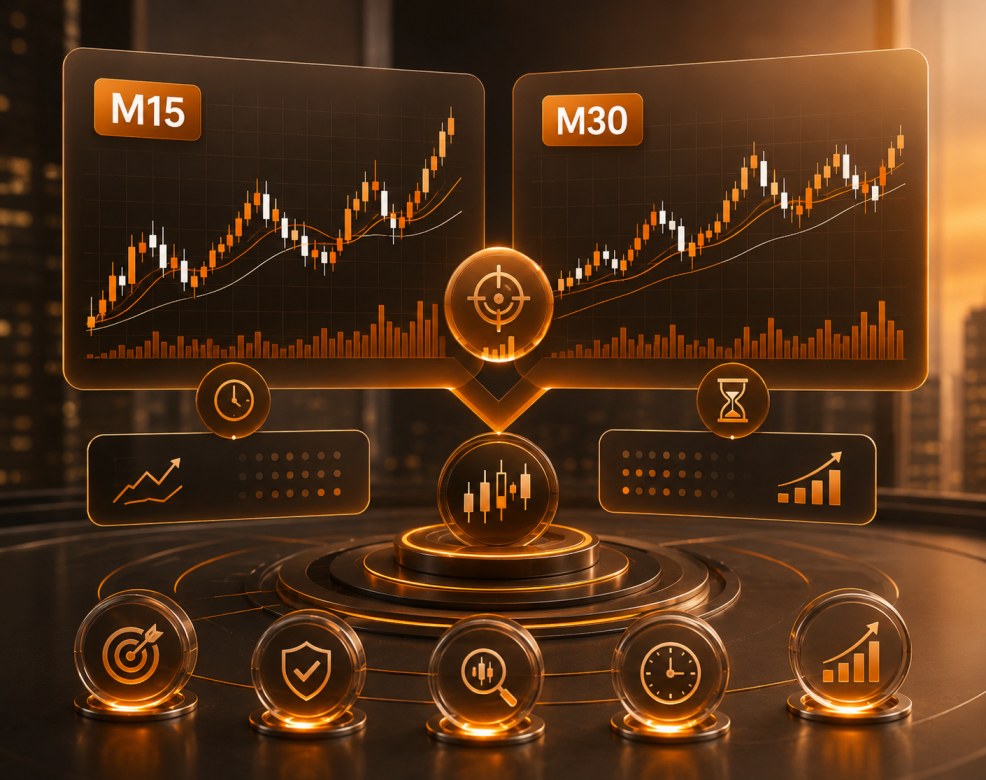
M15 & M30 — The Sweet Spot for Intraday Traders
If the M1 feels like trying to read a book by flipping pages every second, the M15 and M30 give you just enough breathing room to actually think. These time frames filter out the chaotic tick-by-tick noise while still keeping you firmly in day-trading territory.
The M15 chart shows price action in 15-minute candles — enough detail to spot clean entry points, but broad enough to reveal genuine intraday momentum. The M30 stretches that window to half an hour, making patterns more reliable and signals less likely to be whipsaws.
What to Look for on M15 & M30
- Clean break-and-retest setups at intraday support and resistance levels — these time frames make them much easier to identify
- Momentum divergence using RSI or MACD, which is far more readable on M15 than on M1
- Session-based range trading — the M30 chart is especially useful for mapping out the early London session range before the New York breakout

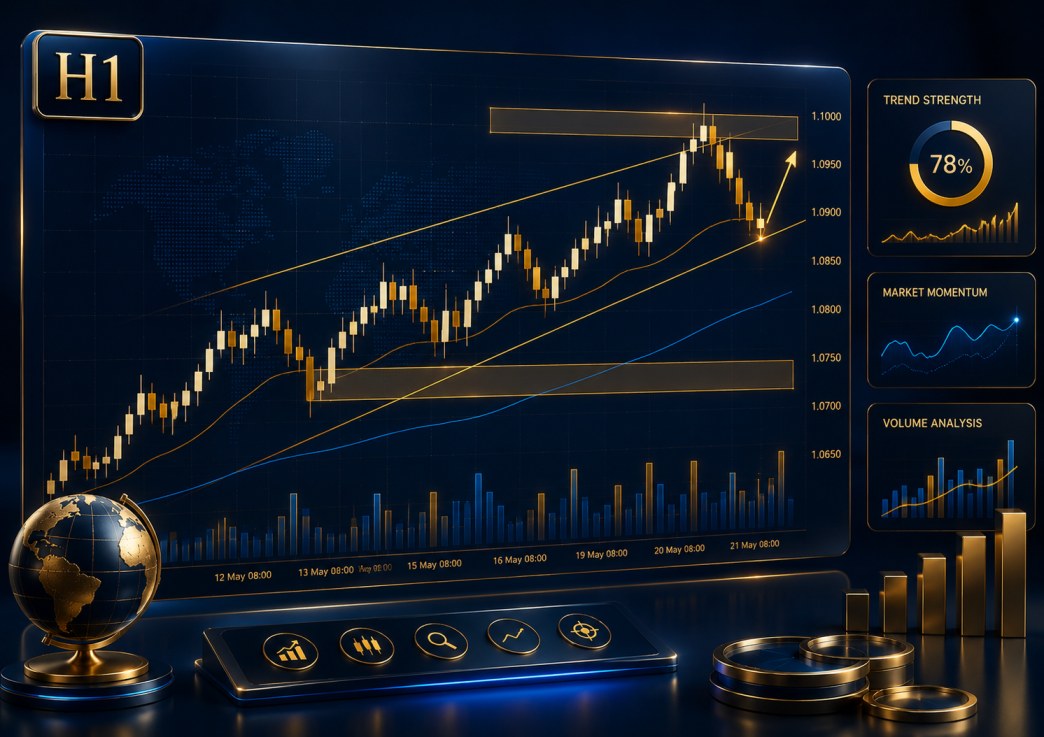
H1 — Where Day Traders Find Clarity
The H1 (one-hour) chart sits at what many experienced traders consider the "goldilocks zone" of day trading. It's fast enough to generate multiple setups in a single session, yet slow enough that each candle carries real weight and meaning.
When you shift from a 15-minute to an hourly chart, the noise largely disappears. Fake breakouts that would trap an M15 trader become clear fakeouts on the H1. Support and resistance levels drawn on the hourly chart are respected by the majority of market participants — because the majority of market participants are watching it.
Practical H1 Trading Tips
- Use H1 for entries after confirming the trend direction on H4 — this top-down approach dramatically improves your trade accuracy
- London-New York session overlap is peak H1 territory: high volume, trending moves, and meaningful candlestick signals
- Set alerts at key H1 levels rather than staring at screens — this preserves your psychological edge over the trading day
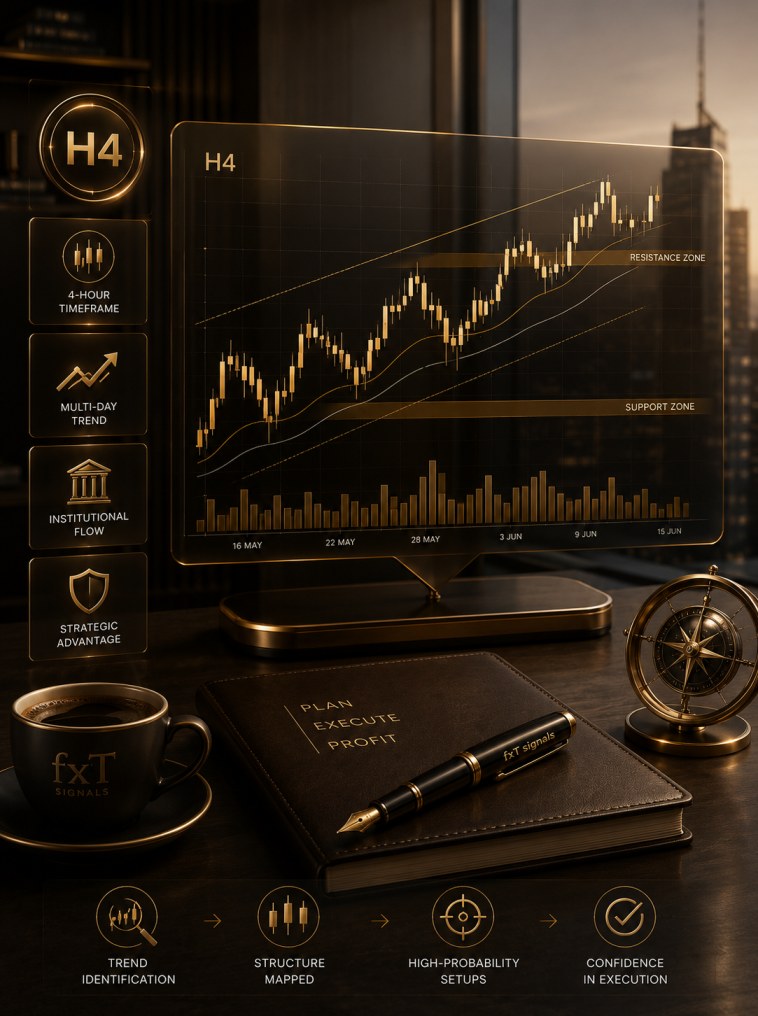
H4 — The Swing Trader's Command Center
If you can only learn one time frame, the argument for H4 is compelling. Four-hour charts paint a complete picture of where the market has been and where it's likely heading — without drowning you in the detail overload of shorter time frames.
Swing traders love H4 because it aligns perfectly with multi-day moves. Positions held from two to fifteen days typically find their ideal entry and exit points on this chart. The candles have enough history to make trend identification reliable, and support and resistance zones carry the weight of institutional interest.
H4 Strategy Essentials
- Draw your key structure levels on H4 first. These become your map for all lower-timeframe entries
- Three-wave pullbacks and Elliott-style patterns are significantly cleaner on H4 than on hourly charts
- Overnight positions become far less stressful when your setup is confirmed on H4 — you're trading with the macro flow, not against it
Always check whether the H4 trend is aligned with the W1 direction before taking a swing trade. Trend alignment across two time frames adds meaningful statistical edge to any setup.
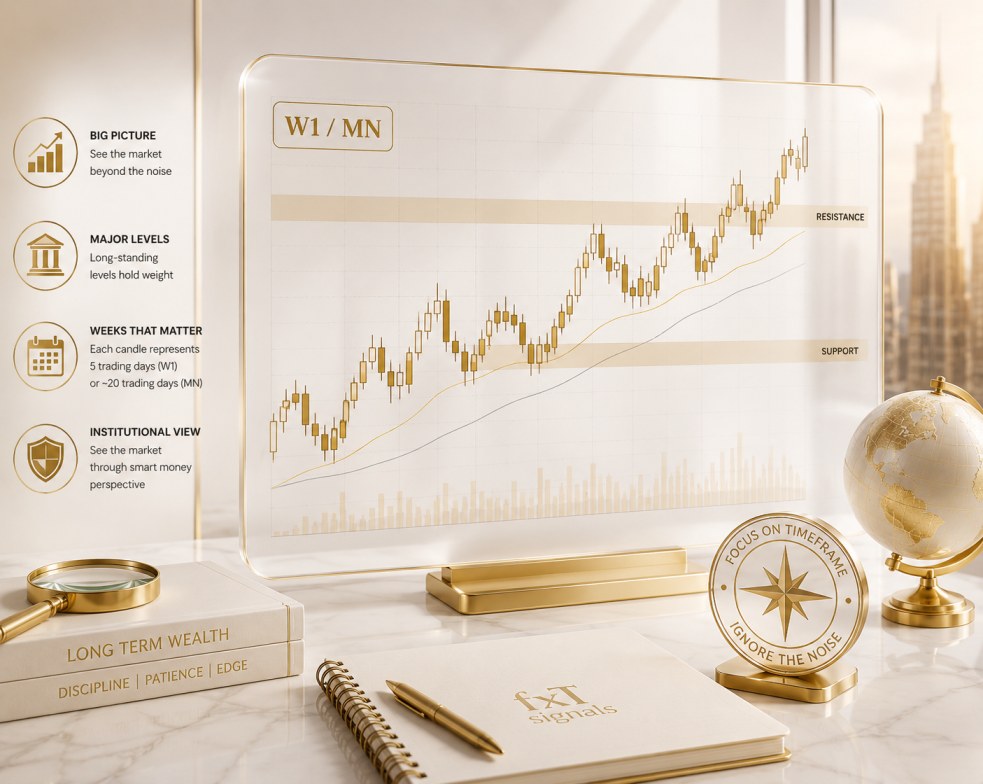
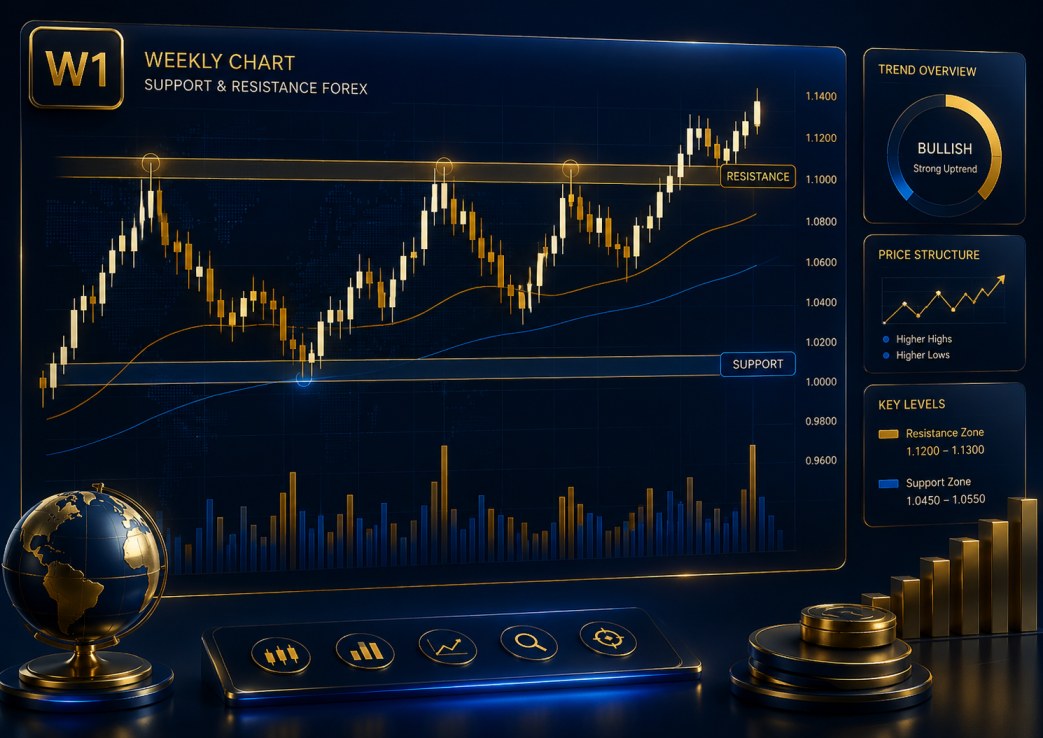
W1 & MN — The Long-Term Lens That Changes Everything
Zoom all the way out to the Weekly (W1) or Monthly (MN) chart and the market looks profoundly different. Short-term volatility that causes panic on a 15-minute chart becomes a tiny ripple on the monthly. Major levels that have held for years become crystal clear.
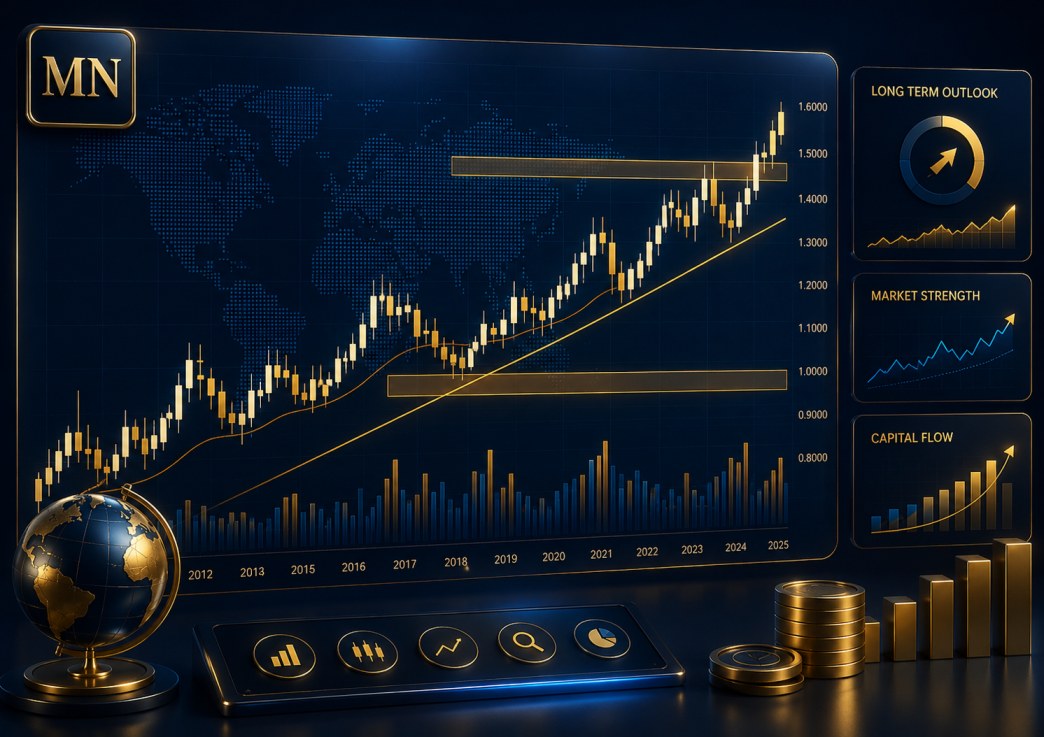
The W1 chart is where position traders and serious investors spend most of their analytical time. A single weekly candle captures five trading days of price action — the battles between bulls and bears over an entire week compressed into a single bar. Monthly candles do the same across 20-22 trading days.
Why Every Trader Should Check W1 and MN
- Even if you trade the H1 or M15, weekly and monthly key levels define the major battlegrounds. Trading into a monthly resistance is a high-risk decision regardless of what the hourly chart says
- Multi-year trends visible only on MN charts reveal secular bull or bear markets that dwarf any short-term signal
- Institutional order flow — the moves made by central banks, hedge funds, and sovereign wealth funds — is most visible at the W1 and MN level

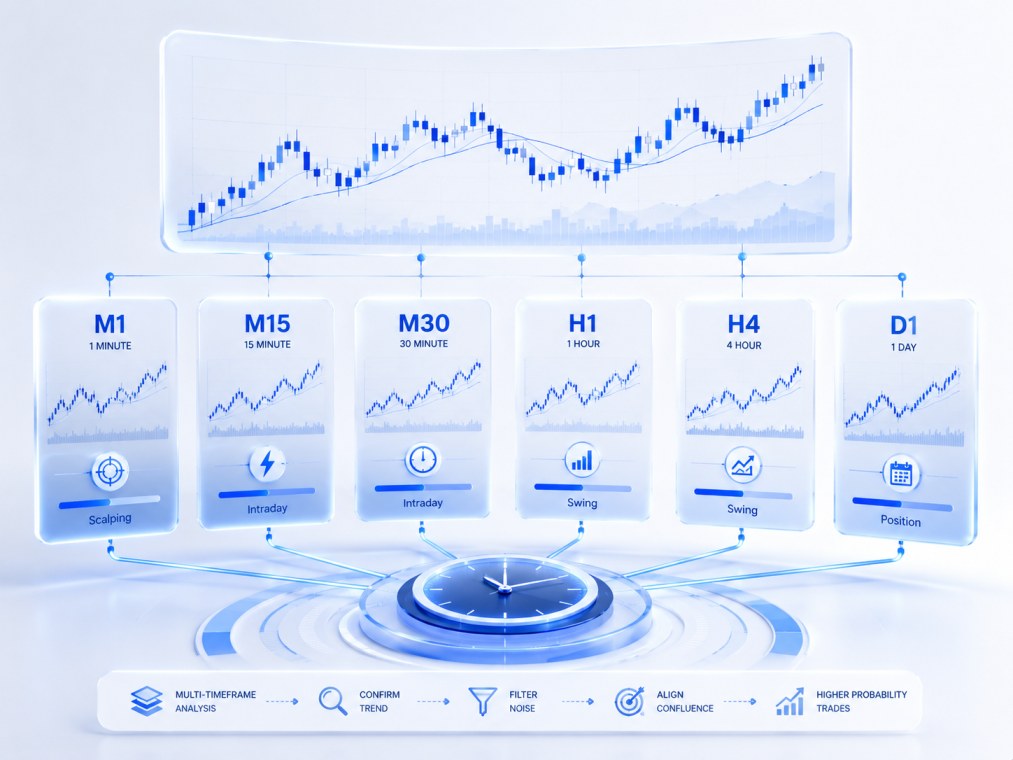
How to Combine Time Frames for Maximum Edge
The most successful forex traders don't rely on one chart. They use a top-down approach — reading the big picture first, then drilling down for precise entries.
Identify the major trend. Is price in a secular bull or bear market? Which decade-old levels define the landscape?
Confirm trend direction and locate the key support / resistance zones your trade must respect.
Find the swing structure. Is price pulling back into a zone, or breaking out? This is where your trade idea forms.
Refine the entry. Look for candlestick confirmation, momentum signals, and a clean risk-reward setup.
Pinpoint entry timing. For traders who want ultra-precise entries with tighter stops, M15 is the final filter.
Scalper's execution layer. Use only for entries already confirmed on higher time frames — never trade M1 in isolation.
The wise trader comprehends the significance of time frames — their mastery offers a gateway to profitable and consistent trading.
— Trading Principle, fxtsignals.comFrequently Asked Questions
Get Professional Forex Signals — Every Time Frame Covered
At FxTsignals, our analysts monitor M1 through MN charts around the clock so you never miss a high-probability setup. Join thousands of traders who rely on us for clear, actionable signals.
Join Our Telegram Signals →