RSI Decoded: The Ultimate Trader's Guide to Relative Strength Index
Whether you're scalping EUR/USD at midnight or swing-trading gold over the weekend, one indicator consistently earns its place on every serious trader's chart — the Relative Strength Index. In this deep-dive, we break down exactly how RSI works, how to read it correctly, and how to use it to make smarter, more confident trading decisions.

What Exactly Is the RSI — And Why Every Forex Trader Should Know It
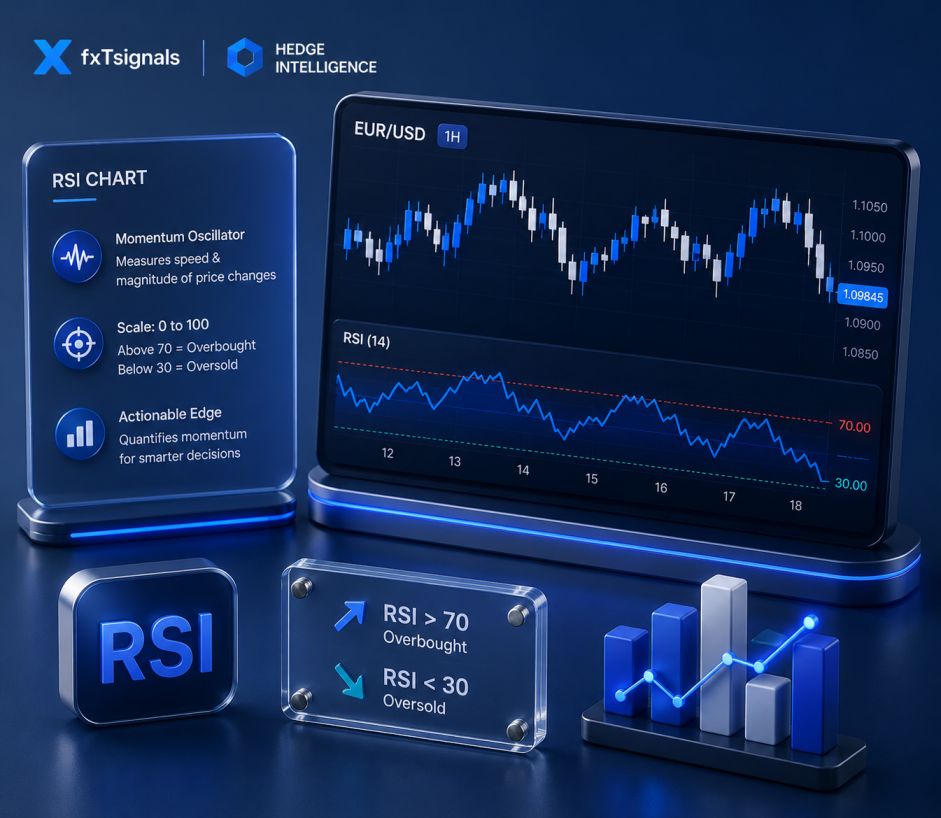
The Relative Strength Index — RSI — is a momentum oscillator developed by J. Welles Wilder Jr. and first introduced in his 1978 book, New Concepts in Technical Trading Systems. In the decades since, it has grown into one of the most widely used technical indicators in forex, equities, and crypto markets alike.
At its core, RSI measures the speed and magnitude of recent price changes to evaluate whether an asset is overbought or oversold. It operates on a scale of 0 to 100. When the RSI climbs above 70, the market is considered to be in overbought territory — signaling that a price pullback could be near. When it drops below 30, the asset is considered oversold, hinting at a potential bounce or reversal.
For forex traders, this creates immediately actionable information. Instead of guessing whether EUR/USD has risen too far too fast, RSI quantifies that question with a precise number. That's a powerful edge — especially in fast-moving currency markets where split-second decisions count.
"In investing, what is comfortable is rarely profitable." — Robert Arnott
The RSI Formula: Simple Math, Powerful Insights
The calculation behind RSI is more straightforward than it might appear. The formula is:
RSI = 100 − [100 / (1 + RS)]
Where RS (Relative Strength) = Average of upward closes ÷ Average of downward closes over the selected period (default: 14 days).
The standard look-back period is 14 candles — whether those are 14 days, 14 hours, or 14 minutes depending on your timeframe. Shorter periods like RSI(7) make the indicator more sensitive and reactive; longer periods like RSI(21) smooth it out, reducing false signals but slowing down your entries.
Reading Overbought & Oversold Conditions Like a Pro
The most beginner-friendly use of RSI is spotting overbought and oversold conditions — and even experienced traders rely on these signals daily. Here's how to read them correctly.
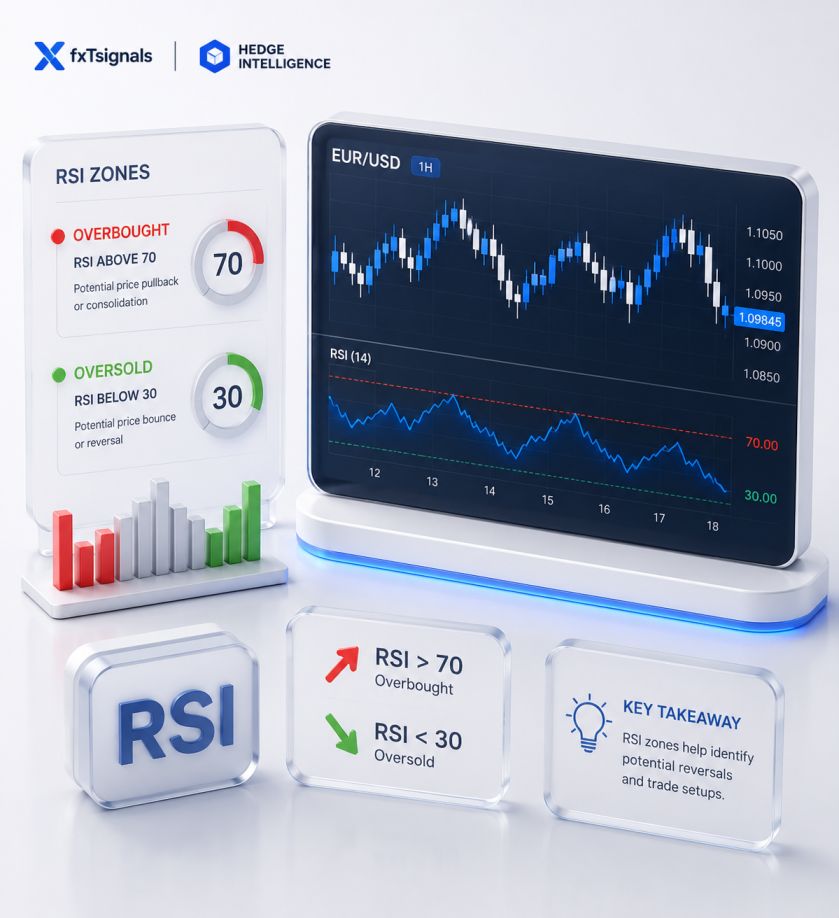
🔴 Overbought: RSI Above 70
When RSI crosses above 70, it's telling you that buyers have been dominant for long enough that exhaustion may be setting in. The price has moved far and fast — and historically, these conditions often precede a correction or consolidation phase.
However, and this is crucial: overbought does not automatically mean sell. In a strong uptrend, RSI can remain above 70 for extended periods. A better approach is to wait for RSI to drop back below 70 from above — this crossover is often a more reliable sell trigger than just the reading itself.
RSI over 70 on a 4-hour EUR/USD chart? Don't panic-sell. Wait for the RSI line to cross back below 70, and look for price confirmation like a bearish engulfing candle or break below short-term support.
🟢 Oversold: RSI Below 30
An RSI reading below 30 suggests sellers have been in control, prices have dropped sharply, and the market may be due for a rebound. This is where smart traders start looking for potential long entries — not blindly, but with additional confirmation.
In forex, oversold RSI readings on the daily chart of pairs like AUD/USD or USD/JPY have historically aligned with strong bounce points. Combined with a key support level or a bullish price action signal, these setups can offer excellent risk-to-reward opportunities.
- RSI above 70 → Watch for pullback; plan short or exit long position
- RSI below 30 → Look for bounce; plan long or exit short position
- RSI near 50 → Neutral zone; trend direction is unclear, reduce position size
- RSI crossing 50 upward → Bullish momentum building; consider adding to longs
- RSI crossing 50 downward → Bearish momentum building; consider shorting
RSI Divergence: The Signal That Can Predict Reversals Before They Happen
If overbought and oversold signals are RSI's bread and butter, divergence is its secret weapon. RSI divergence occurs when price and the RSI indicator move in opposite directions — and it often warns of an upcoming reversal well before the chart candles confirm it.
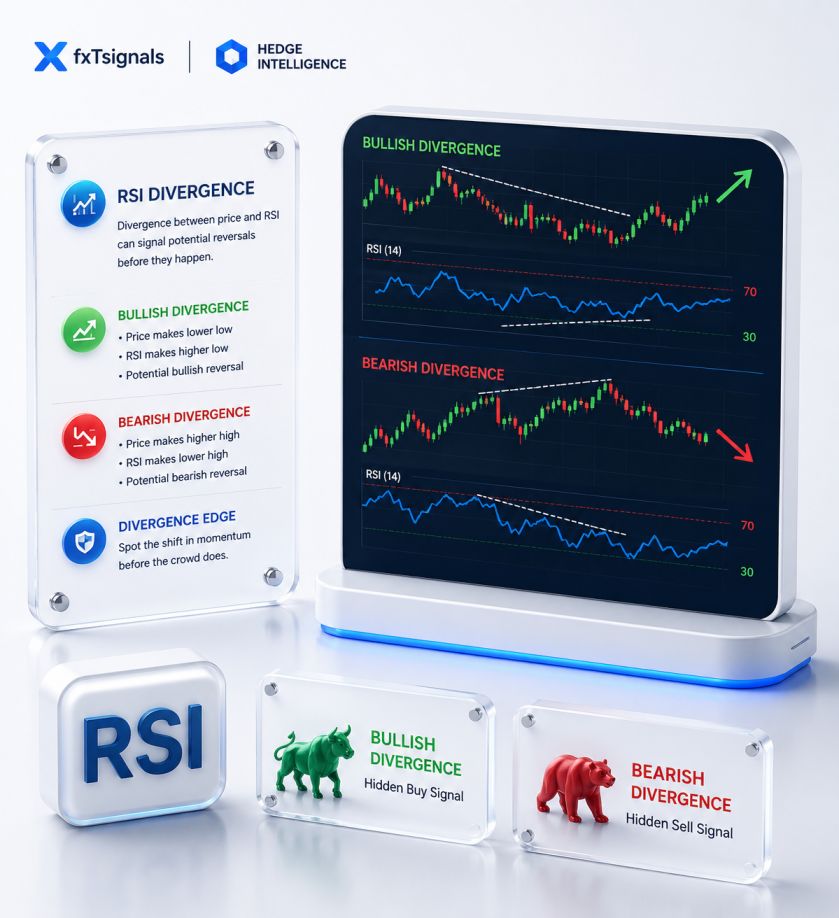
Bullish Divergence — The Hidden Buy Signal
Bullish divergence forms when price makes a lower low, but RSI makes a higher low at the same time. This disconnect tells you that even though price is still falling, the selling momentum is weakening. Buyers are quietly stepping in — and a reversal upward may be imminent.
Example: GBP/USD drops to a new low on Monday. By Wednesday, price makes another low — but RSI's low is actually higher than Monday's RSI low. That's bullish divergence. Many traders use this pattern to time low-risk entries in the direction of the expected reversal.
Bearish Divergence — The Hidden Sell Signal
Bearish divergence is the mirror image. Price makes a higher high, but RSI makes a lower high. This indicates that while the market is still pushing upward, buying momentum is fading. The rally is losing steam, and a downward reversal may be approaching.
RSI divergences don't guarantee reversals — but they shift the probability significantly in your favor when combined with other evidence.
How to Trade RSI Divergence in Practice
- Identify the divergence across at least 2 clear swing points
- Confirm with price action: look for engulfing candles, pin bars, or inside bars
- Check that divergence appears near a key support or resistance zone
- Enter after confirmation — not during the divergence itself
- Set stop-loss beyond the recent swing high or low
- Target the nearest significant resistance (bullish) or support (bearish)
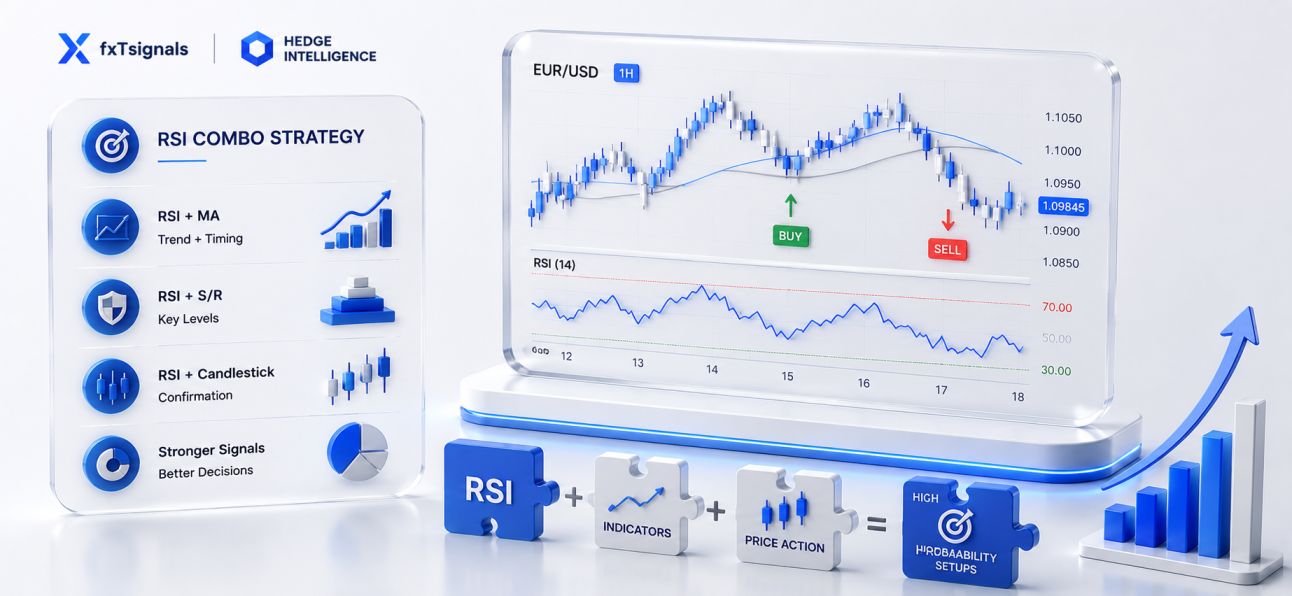
Combining RSI with Other Indicators: Building a High-Probability System
RSI is a remarkable standalone tool, but it becomes genuinely formidable when paired with complementary indicators. No single tool is perfect in all market conditions — but stacking confluences dramatically improves your win rate and risk management.
RSI + Moving Averages
One of the most popular and effective combinations. Use a 50-period or 200-period moving average to define the trend direction, then use RSI to time entries. If price is above the 200 MA (uptrend) and RSI dips below 40 or even 30 and starts to recover — that's a high-probability long entry. You're buying a dip in an established uptrend, confirmed by momentum data. The same logic applies in reverse for downtrends.
RSI + Support & Resistance Levels
Price levels matter deeply in forex. When RSI drops into the oversold zone precisely as price touches a major support level — a previous demand zone, a Fibonacci retracement level, or a round number — the signal quality multiplies. Both the oscillator and the structure are aligning. That confluence is far more meaningful than either signal alone.
RSI + Candlestick Patterns
Never underestimate what the candles themselves are telling you. When RSI divergence appears and a bullish pin bar or hammer forms at the same level — you have momentum data AND price action confirmation working together. That's a trade many professional traders look for every single day.
Combining RSI with two or three confirming factors isn't overcomplicating — it's professional risk management. The more confluences you have, the smaller your stop-loss can be and the better your risk-to-reward ratio becomes.
7 Actionable RSI Tips Every Forex Trader Should Apply Today
Knowing the theory is step one. Applying it profitably is another challenge entirely. Here are seven practical RSI tips that separate disciplined traders from frustrated ones:
- Adjust your RSI period to your style. Day traders often prefer RSI(7) for quicker signals. Swing traders benefit more from RSI(14). Position traders may use RSI(21) for smoother readings.
- Never use RSI in isolation. Always seek at least one confirming signal — trend direction, key level, or candlestick pattern — before acting on any RSI reading.
- Watch for RSI to re-cross the threshold. A reading above 70 means less than RSI falling back below 70. The crossover is the actionable moment, not the reading itself.
- Multi-timeframe analysis is your friend. If RSI shows oversold on the 1-hour chart AND the 4-hour chart simultaneously, the signal carries far more weight.
- Beware false signals in strong trends. In a raging bull market, RSI can stay overbought for days or weeks. Respect the trend and adjust your bias accordingly.
- Use RSI to manage existing trades. If you're in a long position and RSI reaches 75–80, consider partial profit-taking rather than waiting for a full reversal signal.
- Backtest your RSI settings on your specific pairs. EUR/USD and GBP/JPY behave very differently. What works on one may need slight adjustment on another.
Frequently Asked Questions About RSI in Forex Trading
Still have questions? These are the most common ones traders ask about the Relative Strength Index.
Conclusion: RSI Is a Tool — Your Discipline Makes It Powerful

The Relative Strength Index has earned its reputation as one of the most reliable technical indicators in existence — and for good reason. It quantifies momentum, flags extreme conditions, and even hints at reversals before price confirms them. But like any tool, its value depends entirely on the hands wielding it.
Understanding RSI means understanding that markets are emotional. When RSI screams overbought, it's telling you that greed has been running the show. When it dips into oversold territory, fear has taken over. Your job as a trader is to step back from that emotion, read the data, and act with patience and logic.
Combine RSI with solid trend analysis, clean support and resistance levels, and disciplined risk management — and you'll have a trading framework that can genuinely stand the test of time, regardless of what the market throws at you.