MACD Mastery: The Complete Forex Trader's Guide to Moving Average Convergence Divergence
Unlock one of trading's most trusted indicators. Learn how professional forex traders use MACD to spot trends, confirm momentum, and time entries and exits with confidence.
Whether you've been trading forex for two weeks or two decades, you've almost certainly crossed paths with the MACD indicator. It shows up on nearly every trading platform, graces the screens of retail traders and institutional desk operators alike, and has remained relevant through decades of market evolution. But here's the thing — most traders only scratch the surface of what MACD can really do.
In this guide, we're going beyond the basics. We'll break down every element of the MACD indicator in plain language, show you exactly how to read its signals, and give you practical, actionable strategies you can apply to your forex trades today.
The Moving Average Convergence Divergence — MACD for short — was developed by Gerald Appel in the 1970s. Despite being over 50 years old, it remains one of the most widely relied-upon tools in technical analysis. Its staying power isn't accidental. MACD works because it captures something fundamental about how markets move: momentum.
Foundation
What Exactly Is MACD?
At its core, MACD is a trend-following momentum indicator. It measures the relationship between two exponential moving averages of an asset's price and plots the result as a line on your chart. Simple in concept, but remarkably powerful in practice.
MACD doesn't just tell you which direction price is moving — it tells you how strongly it's moving and whether that strength is growing or fading. That combination is what sets it apart from most other indicators.
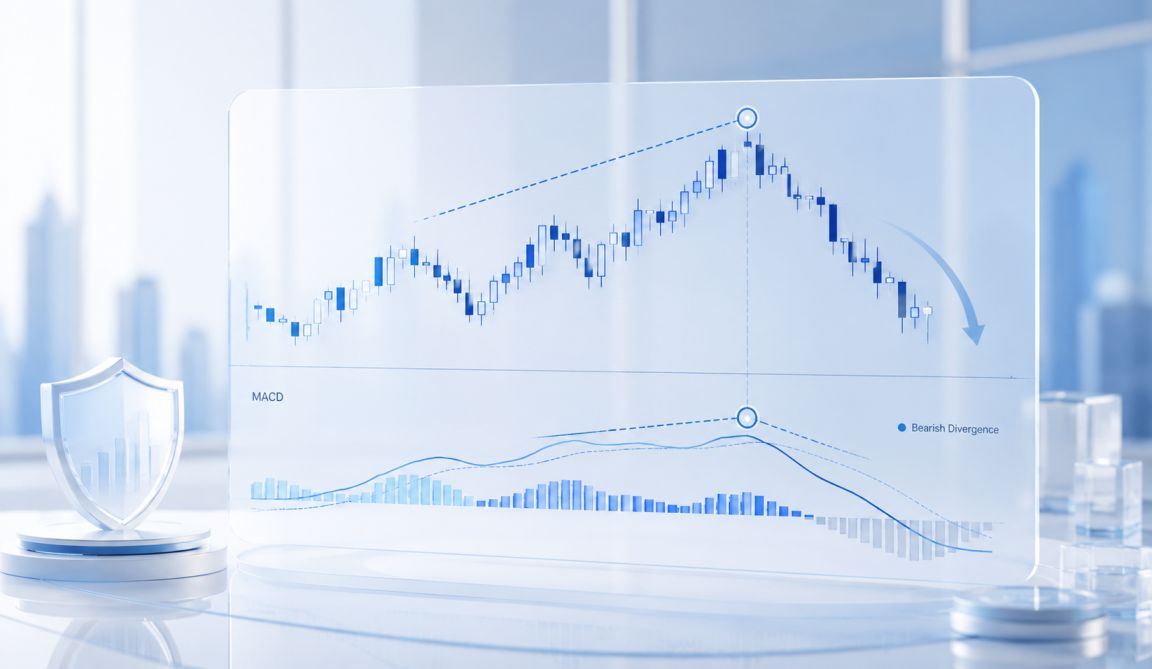
Bearish divergence: price rises but MACD momentum falls
Unlike pure price-action indicators, MACD brings together both price and momentum data into a single view. This dual-layer insight is why forex traders lean on it so heavily — particularly in trending markets where understanding the "fuel" behind a move can mean the difference between a profitable trade and a costly false entry.
MACD is available on every major trading platform — MetaTrader 4, MetaTrader 5, TradingView, cTrader, you name it. It works across all currency pairs, timeframes, and market conditions.
The Three Core Components of MACD
To truly master MACD, you need to understand its three building blocks. Each one tells you something different about the market — and together, they paint a complete picture of momentum.
01
📈
MACD Line (Fast Line)
Calculated by subtracting the 26-period EMA from the 12-period EMA. Shows the gap between short-term and long-term momentum — when it rises, short-term strength is building.
02
〰️
Signal Line (Slow Line)
A 9-period EMA of the MACD line. Acts as a trigger. When the MACD line crosses above the signal line, it signals buying momentum. Below signals selling pressure.
03
📊
MACD Histogram
Visual difference between the MACD and signal lines shown as vertical bars. Rising bars above zero = bullish momentum. Falling bars below zero = bearish pressure growing.
Reading the Market
How to Interpret MACD Signals Like a Pro
Knowing the components is step one. Knowing how to read what they're telling you is where real trading edge develops. Let's walk through the key signal types.
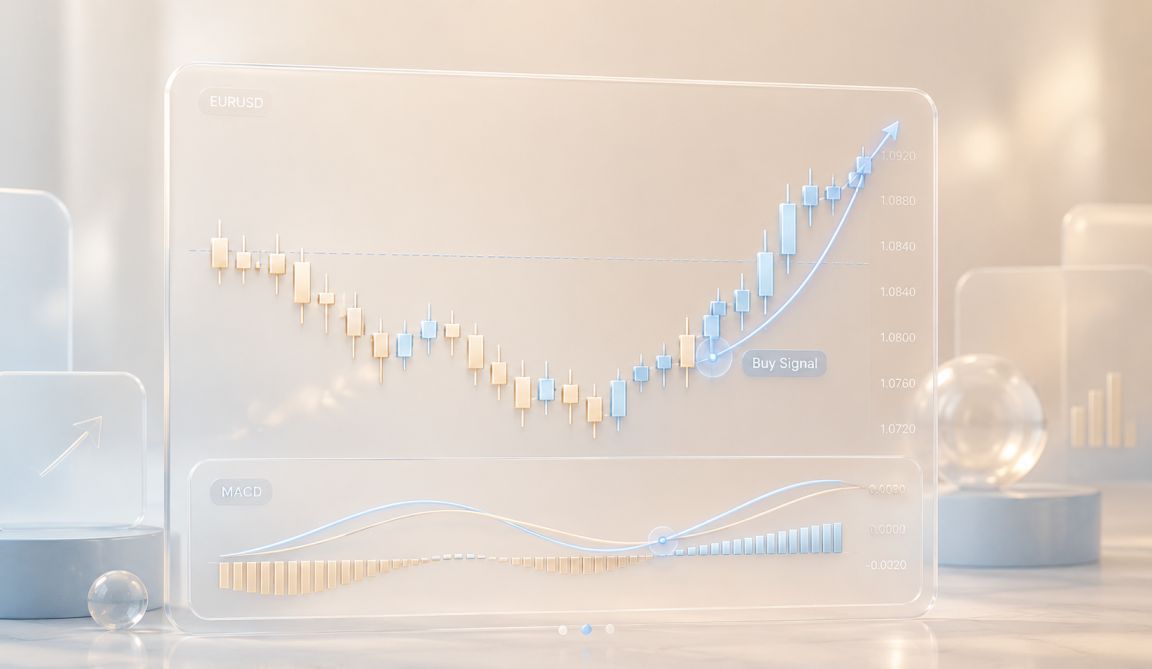
1. Bullish Signal — Time to Consider Going Long
Bullish candlestick patterns often confirm MACD buy signals
When the MACD line crosses above the signal line, the market is telling you that short-term momentum is gaining strength relative to the longer-term trend. This is your classic bullish crossover — a potential buy signal that many forex traders use as their primary entry trigger.
The best bullish crossovers tend to occur when the MACD is crossing from below the zero line toward it, or just above it. These signals, appearing after a period of downward price movement, often represent genuine momentum shifts rather than minor fluctuations.
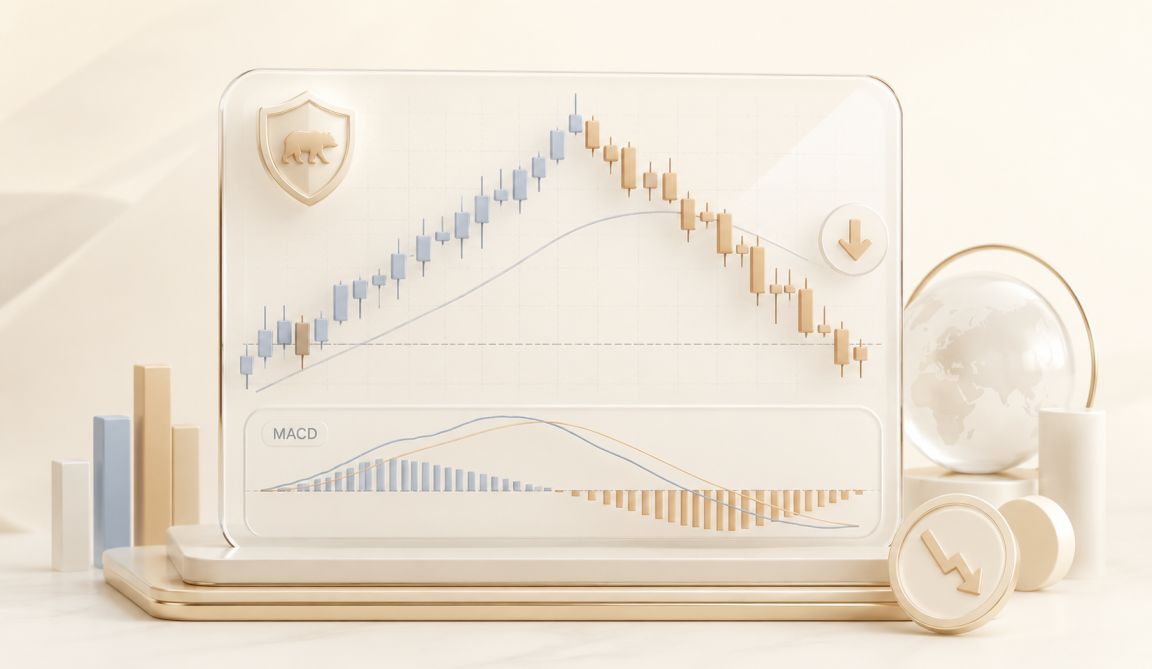
2. Bearish Signal — Consider Exiting or Going Short
Bearish patterns confirming MACD sell signals
The inverse of the bullish crossover. When the MACD line drops below the signal line, short-term momentum is weakening. This is where traders look to tighten stop-losses, consider closing long positions, or set up short trades in the direction of new bearish momentum.
Context matters enormously here. A bearish crossover happening below the zero line in an already established downtrend carries much more weight than one during a brief pullback in a strong uptrend.
3. Divergence — The Hidden Reversal Signal
Divergence is arguably the most powerful — and most underused — MACD signal. It occurs when price and the MACD histogram disagree about the direction of momentum.
Bullish Divergence: Price makes lower lows, but the MACD histogram forms higher lows. Selling pressure is running out — a reversal to the upside may be near.
Bearish Divergence: Price makes higher highs, but the MACD histogram forms lower highs. Buying pressure is weakening — a potential top or reversal zone.
Hidden Divergence: Used in trend-continuation trades. Price forms higher lows but MACD forms lower lows in an uptrend — bullish hidden divergence signals the trend is likely to continue.
💡 Pro tip: Divergence signals are most reliable on H4, Daily, and Weekly charts. On lower timeframes they appear frequently but produce more false signals. Use them as a warning to tighten management rather than a standalone entry trigger.
Strategy
6 Practical MACD Strategies for Forex Traders
Theory is valuable, but what matters is how you apply MACD in live market conditions. Here are six concrete applications traders use every day.
01
Signal Line Crossover Entry
Wait for the MACD line to cross the signal line, confirm direction with a higher-timeframe trend bias, then enter. Use the recent swing high/low as your stop.
02
Zero Line Cross Confirmation
When the MACD line crosses above the zero line, the short-term average has overtaken the long-term — a stronger bullish signal. Use zero line reclaims to filter weaker setups.
03
Divergence Reversal Trades
Spot divergence on H4 or Daily charts. Wait for a candlestick confirmation pattern (engulfing, pin bar), then enter with tight risk management. Often excellent risk-to-reward.
04
Histogram Trend Strength Filter
Only take long trades when histogram bars grow above zero, shorts when they grow below. Shrinking bars signal to stay out or reduce position size.
05
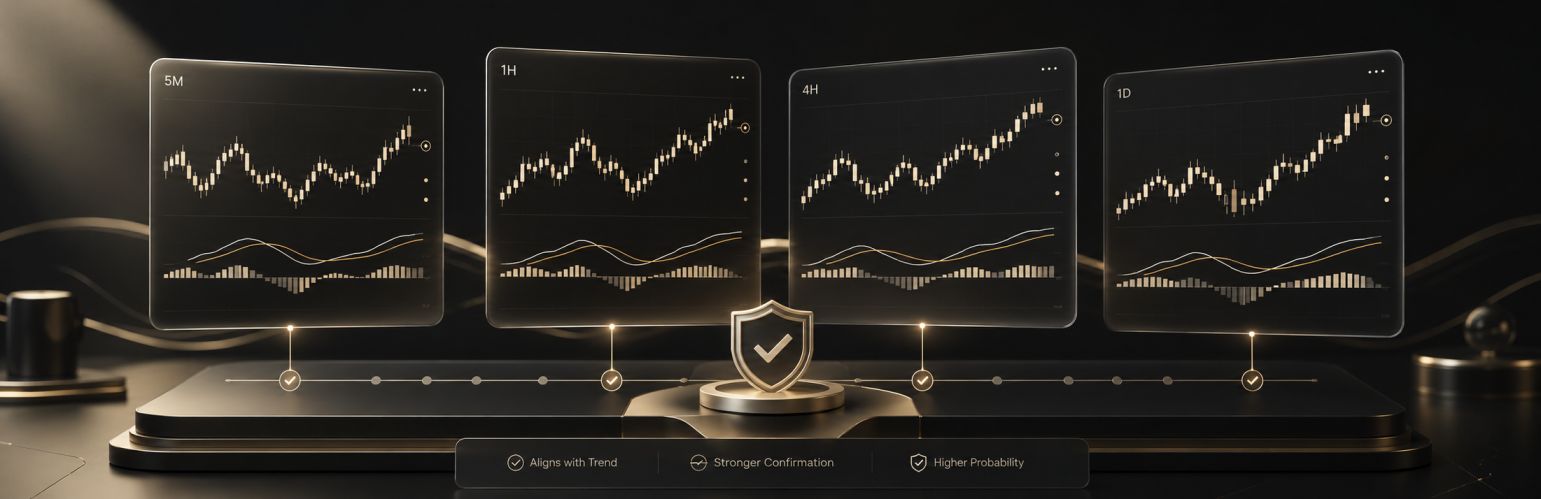
Multi-Timeframe MACD Analysis
Check the daily for trend direction, drop to H4 or H1 for a crossover entry in the same direction. When all timeframes align, conviction is highest.
06
MACD + RSI Confluence
Combine MACD crossover signals with RSI extremes (below 30 for buys, above 70 for sells). When both indicators agree, trade probability increases substantially.
Mistakes to Avoid
MACD Pitfalls Every Trader Should Know
Even experienced traders make avoidable MACD mistakes. Here's what to watch out for.
Trading every crossover without context. A crossover in a choppy, range-bound market is far less reliable than one after a clear trend phase. Always check market structure first.
Ignoring the histogram. Many traders focus on the lines while neglecting the histogram — which often provides earlier warnings of momentum shifts before the crossover appears.
Using default settings blindly. The standard 12/26/9 settings work well broadly, but adjusting to 8/21/5 for faster signals, or 19/39/9 for swing trading, can better suit your strategy.
Treating MACD as a standalone system. MACD works best as part of a complete approach — combine it with price action analysis, support and resistance, and proper position sizing.
Chasing late crossovers. If you miss the initial crossover, wait for the next setup. Entering late destroys risk-to-reward ratios significantly.
Multi-timeframe MACD analysis showing trend alignment across Daily and H4 charts
FAQ
Frequently Asked Questions About MACD
The default 12/26/9 settings are a solid starting point and work well on H1, H4, and daily charts. For faster scalping strategies, consider shortening to 8/17/9. For swing trading on daily or weekly charts, some traders prefer 19/39/9 to reduce noise. Always backtest on your preferred pairs before committing real capital.
MACD is primarily a lagging indicator because it's derived from historical moving averages. However, MACD divergence gives it some leading qualities — it can warn you of a potential reversal before price confirms it. Crossovers confirm what has already started (lagging), while divergence can foreshadow what's coming (leading).
MACD performs best in trending markets and is significantly less reliable in sideways conditions. In a range, it generates frequent crossovers that produce false signals. If you're trading ranging markets, use an oscillator like RSI or Stochastic as your primary tool, and use MACD as a secondary filter to identify when the range is about to break.
Identify the overall trend on a higher timeframe (H4 or Daily). Look for instances where price makes a new extreme while the MACD histogram forms a contradictory pattern. Wait for a confirming candlestick pattern before entering. Place your stop just beyond the recent swing extreme and target the next significant support or resistance level.
MACD measures the relationship between two moving averages and focuses on momentum and trend direction. RSI measures the speed of price changes on a 0–100 scale, identifying overbought and oversold conditions. MACD excels at finding trend entry points; RSI is better for identifying exhaustion levels. Used together, they create a powerful, well-rounded trading framework.
Ready to Trade Smarter with MACD?
Join thousands of forex traders who rely on fxTsignals.com for professional technical analysis, real-time MACD signals, and proven trading strategies. Stop guessing — start trading with confidence.
The Moving Average Convergence Divergence indicator has stood the test of time for one simple reason: it works. By combining trend direction with momentum strength in a single, easy-to-read display, MACD gives forex traders a genuine edge in understanding what's actually happening beneath the surface of price action.
Whether you're using MACD to time your entries on the daily chart, filter out low-probability trades on the H4, or spot early divergence signals before a major reversal, the key is consistency. Use it systematically, combine it with complementary tools, and always let risk management be your foundation.
At fxTsignals.com, we incorporate MACD analysis into our daily signal process alongside multi-timeframe trend alignment, support/resistance levels, and candlestick confirmation. Because in forex trading, confluence is everything. The more evidence pointing in the same direction, the stronger your trade setup becomes. Happy trading.